Download

1 / 22
240 likes | 1.76k Vues
The t Test for Two Independent Samples Compare means of two groups Experimental—treatment versus control Existing groups—males versus females Notation—subscripts indicate group M 1 , s 1 , n 1 M 2 , s 2 , n 2 Null and alternative hypotheses

E N D
The t Test for Two Independent Samples • Compare means of two groups • Experimental—treatment versus control • Existing groups—males versus females • Notation—subscripts indicate group • M1, s1, n1 M2, s2, n2 • Null and alternative hypotheses • translates into • translates into
Criteria for use • Dependent variable is quantitative, interval/ratio • Independent variable between-subjects • Independent variable has two levels • t-test • Basic form • One sample
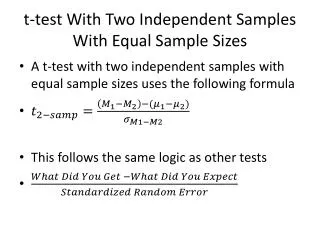
Two sample • Difference between sample means M1 - M2 • Population parameter • Sampling distribution of the difference • Difference between M1 and M2 drawn from population
Standard error of the difference • Population variance known • Sum of • Estimate from samples • Differences more variable than scores
Variability of mean differences • Randomly generated set of 1000 means • Μ= 50, σM = 10 • Take difference between pairs
S2pooled Pooled Variance • Homogeneity of variance • Assume two samples come from populations with equal σ2’s • Two estimates of σ2 — and • Weighted average
Hypothesis testing • Two-tailed • H0: µ1 = µ2, µ1 - µ2 = 0 • H1: µ1 ≠ µ2, µ1 - µ2 ≠ 0 • One-tailed • H0: µ1 ≥ µ2, µ1 - µ2 ≥ 0 • H1: µ1 < µ2, µ1 - µ2 < 0 • Determine α • Critical value of t • df = n1 + n2 - 2
Assumptions • Random and independent samples • Normality • Homogeneity of variance • SPSS—test for equality of variances, unequal variances t test • t-test is robust
H0: µ1 = µ2, µ1 - µ2 = 0 H1: µ1 ≠ µ2, µ1 - µ2 ≠ 0 df = n1 + n2 - 2 =10 + 7 – 2 = 15 =.05 t(15) = 2.131 Example 1
df = n1 + n2 - 2 = 15 + 15 – 2 = 28 =.05, t(28) = 2.049 Example 2
Confidence Interval for the Difference • Example 1 • -3.257 - (2.131*1.401) < µ1 - µ2 < -3.257 + (2.131*1.401) = -6.243 < µ1 - µ2 < -0.272 • Example 2 • -0.867 - (1.701*5.221) < µ1 - µ2 < -0.867 + (1.701*5.221) = -9.748 < µ1 - µ2 < 8.014 • Includes 0 retain H0
SPSS • Analyze • Compare Means • Independent-Samples T Test • Dependent variable(s)—Test Variable(s) • Independent variable—Grouping Variable • Define Groups • Cut point value • Output • Levene’s Test for Equality of Variances • t Tests • Equal variances assumed • Equal variances not assumed
Effect size • Cohen’s d = • Example 1 Cohen’s d • Example 2 Cohen’s d • r2 or η2 • G = grand mean
Factors Influencing t–test and Effect Size • Mean difference M1 – M2 • Larger difference, larger t • Larger difference, larger r2 and Cohen’s d
Example 1, subtract 1 from first group, add 2 to second group • M1 – M2 increases from –3.257 to –6.257 • unaffected t increases from –2.325 to –4.466 • r2increases from
Magnitude of sample variances • As sample variances increase: • t decreases • Cohen’s d and r2 decreases • SSExplainedunchanged, SSErrorand SSTotal increases, S2pooled increases
Sample size • Larger sample smaller t affects • No effect on Cohen’s d, minimal effect on r2 • First example increase n1from 10 to 30 and n2 from 7 to 21