Non-Linear Models
Non-Linear Models. Tractable non-linearity Equation may be transformed to a linear model. Intractable non-linearity No linear transform exists. Tractable Non-Linear Models. Several general Types Polynomial Power Functions Exponential Functions Logarithmic Functions


Non-Linear Models
E N D
Presentation Transcript
Non-Linear Models • Tractable non-linearity • Equation may be transformed to a linear model. • Intractable non-linearity • No linear transform exists
Tractable Non-Linear Models • Several general Types • Polynomial • Power Functions • Exponential Functions • Logarithmic Functions • Trigonometric Functions
Polynomial Models • Linear • Parabolic • Cubic & higher order polynomials • All may be estimated with OLS – simply square, cube, etc. the independent variable.
Power Functions • Simple exponents of the Independent Variable • Estimated with
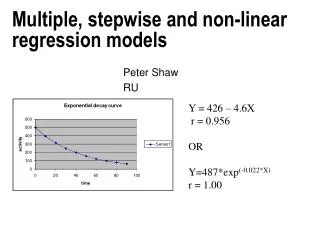
Exponential and Logarithmic Functions • Common Growth Curve Formula • Estimated with • Note that the error terms are now no longer normally distributed!
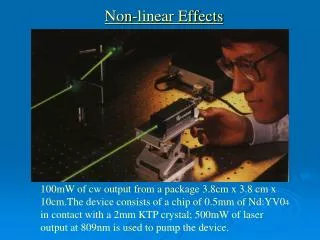
Trigonometric Functions • Sine/Cosine functions • Fourier series – Harmonic Analysis • See Wolfram’s Mathworld for pictures
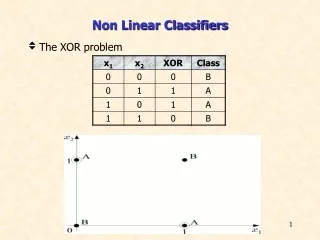
Intractable Non-linearity • Occasionally we have models that we cannot transform to linear ones. • For instance a logit model • Or an equilibrium system model
An equilibrium system model • Take for instance the impact of the 1st debate on the 2012 presidential election. (See Nate Silver’s 538 Blog.) • The “b” measures the impact of the debate, while the “c” estimates the rate of decay back to equiulibrium
Intractable Non-linearity • Models such as these must be estimated by other means. • We do, however, keep the criteria of minimizing the squared error as our means of determining the best model
Estimating Non-linear models • All methods of non-linear estimation require an iterative search for the best fitting parameter values. • They differ in how they modify and search for those values that minimize the SSE.
Methods of Non-linear Estimation • There are several methods of selecting parameters • Grid search • Steepest descent • Marquardts algorithm
Grid search estimation • In a grid search estimation, we simply try out a set of parameters across a set of ranges and calculate the SSE. • We then ascertain where in the range (or at which end) the SSE was at a minimum. • We then repeat with either extending the range, or reducing the range and searching with smaller grid around the estimated SSE • Try the spreadsheet • Try this for homework!
Regression Diagnostics • Some cases are very influential in regression models • There are two ways to describe the influence that case may exert • Residual • Leverage • Examination of these particular cases may lead us to theoretical insight.
Regression Diagnostics • Residual • Outliers – extreme measures weaken the goodness of fit indexes and hypothesis tests • Studentized residuals • where hii is the hat diagonal
Residual Diagnostics (cont.) • Rstudent • Note that examination of these t-values this actually entails n hypothesis tests. • This should actually requires a Bonferoni correction to α, where α*= α/n • or p(ti)* = p(ti)=p*n
Residual Diagnostics (cont.) • Leverage – influential observation • Hat diagonal – a measure of the observations “remoteness” in X-space. • Hat diagonals (leverage) greater than 2 times the number of coefficients in the model divided by the number of observations are considered significant.
Residual Diagnostics (cont.) • Leverage (cont.) • Cook’s D • If D is greater than 1, then the observation is influential.
Residual Diagnostics (cont.) • Leverage (cont.) • dffits • If dffits is greater than 1, then the observation is influential.
Residual Diagnostics (cont.) • Leverage (cont.) • Dfbetas – an indicator of how much a given observation influences each regression coefficient