Non-linear tracking
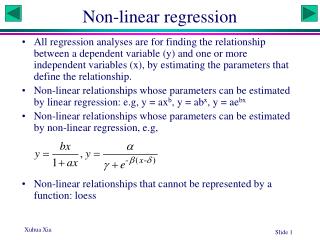
Non-linear tracking. Marc Pollefeys COMP 256. Some slides and illustrations from D. Forsyth, M. Isard, T. Darrell …. Tentative class schedule. Final project presentation. No further assignments, focus on project Final presentation: Presentation and/or Demo

Non-linear tracking
E N D
Presentation Transcript
Non-linear tracking Marc Pollefeys COMP 256 Some slides and illustrations from D. Forsyth, M. Isard, T. Darrell …
Final project presentation No further assignments, focus on project Final presentation: • Presentation and/or Demo (your choice, but let me know) • Short paper (Due April 22 by 23:59) (preferably Latex IEEE proc. style) • Final presentation/demo April 24 and 26
System state dynamics Observation dynamics We are interested in: Belief or posterior density Bayes Filters Estimating system state from noisy observations
Recall “law of total probability” and “Bayes’ rule” From above, constructing two steps of Bayes Filters Predict: Update:
Assumptions: Markov Process Predict: Update:
Bayes Filter How to use it? What else to know? Motion Model Perceptual Model Start from:
Step 0: initialization Step 1: updating Example 1
Step 3: updating Step 4: predicting Step 2: predicting Example 1 (continue)
Several types of Bayes filters • They differs in how to represent probability densities • Kalman filter • Multihypothesis filter • Grid-based approach • Topological approach • Particle filter
Recall general problem Assumptions of Kalman Filter: Belief of Kalman Filter is actually a unimodal Gaussian Advantage: computational efficiency Disadvantage: assumptions too restrictive Kalman Filter
Multi-hypothesis Tracking • Belief is a mixture of Gaussian • Tracking each Gaussian hypothesis using a Kalman filter • Deciding weights on the basis of how well the hypothesis predict the sensor measurements • Advantage: • can represent multimodal Gaussian • Disadvantage: • Computationally expensive • Difficult to decide on hypotheses
Grid-based Approaches • Using discrete, piecewise constant representations of the belief • Tessellate the environment into small patches, with each patch containing the belief of object in it • Advantage: • Able to represent arbitrary distributions over the discrete state space • Disadvantage • Computational and space complexity required to keep the position grid in memory and update it
Topological approaches • A graph representing the state space • node representing object’s location (e.g. a room) • edge representing the connectivity (e.g. hallway) • Advantage • Efficiency, because state space is small • Disadvantage • Coarseness of representation
Particle filters • Also known as Sequential Monte Carlo Methods • Representing belief by sets of samples or particles are nonnegative weights called importance factors • Updating procedure is sequential importance sampling with re-sampling
Step 0: initialization Each particle has the same weight Step 1: updating weights. Weights are proportional to p(z|x) Example 2: Particle Filter
Step 3: updating weights. Weights are proportional to p(z|x) Step 4: predicting. Predict the new locations of particles. Step 2: predicting. Predict the new locations of particles. Example 2: Particle Filter Particles are more concentrated in the region where the person is more likely to be
Compare Particle Filter with Bayes Filter with Known Distribution Updating Example 1 Example 2 Predicting Example 1 Example 2
Comments on Particle Filters • Advantage: • Able to represent arbitrary density • Converging to true posterior even for non-Gaussian and nonlinear system • Efficient in the sense that particles tend to focus on regions with high probability • Disadvantage • Worst-case complexity grows exponentially in the dimensions
Particle Filtering in CV: Initial Particle Set • Particles at t = 0 drawn from wide prior because of large initial uncertainty • Gaussian with large covariance • Uniform distribution from MacCormick & Blake, 1998 State includes shape & position; prior more constrained for shape
¼(1) ¼(N) ¼(2) ¼(N-1) ¼(3) courtesy of D. Fox Particle Filtering: Sampling • Normalize N particle weights so that they sum to 1 • Resample particles by picking randomly and uniformly in [0, 1] range Ntimes • Analogous to spinning a roulette wheel with arc-lengths of bins equal to particle weights • Adaptively focuses on promising areas of state space
Deterministic component (aka “drift”) Random component (aka “diffusion”) Particle Filtering: Prediction • Update each particle using generative form of dynamics: • Drift may be nonlinear (i.e., different displacement for each particle) • Each particle diffuses independently • Typically modeled with a Gaussian
Particle Filtering: Measurement • For each particle s(i), compute new weight ¼(i) as measurement likelihood ¼(i) =P (zjs(i)) • Enforcing plausibility: Particles that represent impossible configurations are given 0 likelihood • E.g., positions outside of image from MacCormick & Blake, 1998 A snake measurement likelihood method
Sampling occurs here Particle Filtering Steps (aka CONDENSATION) drift diffuse measurement likelihood measure from Isard & Blake, 1998
Particle Filtering Visualization courtesy of M. Isard 1-D system, red curve is measurement likelihood
CONDENSATION: Example State Posterior from Isard & Blake, 1998 Note how initial distribution “sharpens”
Example: Contour-based Head Template Tracking courtesy of A. Blake
Example: Recovering from Distraction from Isard & Blake, 1998
Obtaining a State Estimate • Note that there’s no explicit state estimate maintained—just a “cloud” of particles • Can obtain an estimate at a particular time by querying the current particle set • Some approaches • “Mean” particle • Weighted sum of particles • Confidence: inverse variance • Really want a mode finder—mean of tallest peak
Condensation:Estimating Target State From Isard & Blake, 1998 State samples (thickness proportional to weight) Mean of weighted state samples
Multi-Modal Posteriors • The MAP estimate is just the tallest one when there are multiple peaks in the posterior • This is fine when one peak dominates, but when they are of comparable heights, we might sometimes pick the wrong one • Committing to just one possibility can lead to mistracking • Want a wider sense of the posterior distribution to keep track of other good candidate states adapted from [Hong, 1995] Multiple peaks in the measurement likelihood
MCMC-based particle filter (Khan, Balch & Dellaert PAMI05) Model interaction (higher dimensional state-space) CNN video