Non-Linear Relationships
This guide explores the use of residual plots to assess non-linear relationships in regression modeling. Key concepts include identifying correlation strength and direction, recognizing outliers, and the interpretation of residual values. It explains how to create residual plots using a graphing calculator and what to look for in the data's randomness, which indicates the suitability of the model. Additionally, we delve into an example involving golfers to illustrate the estimation of residuals and the appropriateness of a linear model based on empirical data.


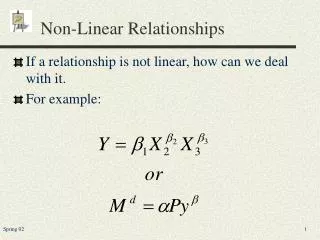
Non-Linear Relationships
E N D
Presentation Transcript
Non-Linear Relationships Residual Plots
Try this … • When discussing an association, we look at the following elements: • D • O • F • S • Correlation can help us identify the ________and ________of the linear association. irection utlier orm trength direction strength
Form Outliers • _______ are easily spotted. • Correlation does not indicate what the _____ of the association is. • A ___________ can help us make a decision as to which model would produce the best prediction. form residual plot
Making a Residual Plot ŷ = 25.3 + 3.66x 71.416 2.584 -3.488 68.488 3 69.952 1.048 2 67.756 -0.756 1 Residual -0.952 69.952 0 67.024 0.976 -1 72.148 -2.148 -2 -3 69.952 -0.952 11.4 11.6 11.8 12.0 12.2 12.4 12.6 68.488 2.512 Shoe Size 0.584 71.416
Calculator Your graphing calculator can create the residual plot for you! Enter the explanatory variable into L1 and the response variable into L2. Tell the calculator to use the explanatory variable and the residuals. 3. Look at the Residual Plot
Good Choices • If the residual plot is random, you have found a good model. • If the residual plot takes on a form, the hunt for a good model must continue. • Today’s model ____ good. was Hence, using a linear regression to model today’s association is ___________. appropriate
Example • Based on the residual plot, is a linear model appropriate for this association? Yes • The point highlighted is for the golfer David Duval. Estimate his residual from the graph and interpret its value. 1.7; In 2009, Duval’s scoring average was about 1.7 strokes more than expected. • If you were to predict the scoring average for a golfer with a putting average of 1.86, would you expect your prediction to be too low, too high, or just about right? Explain. A least-squares regression line was used to model the relationship between putting average and scoring average for golfers on the 2009 PGA tour. The corresponding residual plot is shown. Just about right; Residual plot is random it’s a good model.
Sum it Up explanatory • A residual plot displays the values of the __________ variable on the horizontal axis and the value of the _______ on the vertical axis. • We use residual plots to determine whether the form of a model matches the form of an __________ between two numerical variables. • The residual plot is appropriate if the plots are ________. residual association scattered • The residual plot is inappropriate if the plots _____________. take on a form