Download
1 / 53
530 likes | 651 Vues
Lesson 13 Introduction To Quality. quality is the ability of a product or service to consistently meet or exceed customer expectations. The Evolution of Quality. . Industrial revolution - smaller jobs, more specialization and less responsibility for the final product

E N D
Lesson 13 Introduction To Quality quality is the ability of a product or service to consistently meet or exceed customer expectations
The Evolution of Quality . Industrial revolution - smaller jobs, more specialization and less responsibility for the final product . Early 1900’s - product inspection introduced -Fredrick Winslow Taylor . 1924 - statistical control charts - W. Shewhart of Bell Laboratories . 1930, - acceptance sampling - H.F. Dodge & H.G. Roming of Bell Labs . WWII - statistical methods began to be more widely accepted, especially in statistical sampling techniques . 1950’s - quality assurance, statistical quality control methods introduced to the Japanese - W. Edwards Deming - “cost of quality” concepts - Joseph Juran - “total quality control” including product design and materials - Armand Feigenbaum . 1960’s - “zero defects” emphasize employee performance - P. Crosby . 1970’s - quality assurance methods throughout the entire process
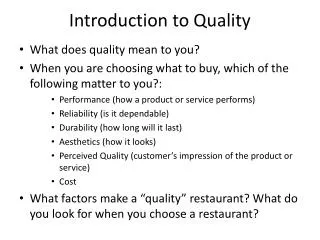
Quality – What Is It? “The degree of excellence of a thing” (Webster’s Dictionary) “The totality of features and characteristics that satisfy needs” (American Society for Quality Control – ASQ) Fitness for consumer use – meet or exceed customer expectations
Mercedes Hyundai Porsche Beetle Quality – What Is It?
Porsche Dimensions of Quality Performance -characteristics of the product or service Aesthetics -appearance, feel, smell, taste Special features -extra characteristics Conformance -customer’s expectations Safety -risk of injury or harm Reliability -consistency of performance Durability -useful life of the product or service Perception -reputation Service after the sale -handling of complaints, customer satisfaction
(Product) (Service) Automobile Auto Repair Examples Of Quality Dimensions Dimension Everything works, fit & finish All work done, at agreed price Performance Ride, handling, grade of Friendliness, courtesy, materials used Competency, quickness Clean work/waiting area Interior design, soft touch Aesthetics Location, call when ready Gauge/control placement Special features Computer diagnostics Cellular phone, CD player Convenience High tech Separate waiting area Antilock brakes, airbags Safety
(Product) (Service) Automobile Auto Repair Examples Of Quality Dimensions Dimension Reliability Infrequency of breakdowns Work done correctly, ready when promised Durability Useful life in miles, resistance to Work holds up over time rust & corrosion Perceived Top-rated car Award-winning service quality department Service after Handling of complaints and/or Handling of complaints sale requests for information
The Determinants of Quality Quality of Design - intention of designers to include or exclude features in a product or service designed to meet a customer/client need/want/requirement.- it represents the inherent value of the product or service in the marketplace . Poor design can result in manufacturing or service problems . Customer disapproval Quality conformance - the degree to which the goods or services conform to the intent of the designers . Requires customer education/awareness as to the intended use of the product/service (e.g. Electrical requirements, medication instructions, attorney advice) Ease of use Service after delivery
Fitness For Consumer Use Quality Producer’s Perspective Consumer’s Perspective Quality of Conformance Quality of Design Production Marketing • Conformance to • specifications • Cost • Dimensions • Price Fitness for Consumer Use
Mercedes Hyundai Porsche Beetle Quality – What Is It?
The Consequences Of Poor Quality . Loss of business . Liability . Productivity . Costs Failures will occur. The prevailing quality philosophy is that prevention is the best cure for quality problems. (An ounce of prevention is worth a pound of cure).
Costs Of Quality When considering the “costs of quality” we must consider: Failure costs - costs caused by defective parts, products, or faulty services . Internal - failures discovered during production (e.g. rework, problems, material/product losses, downtime) . External - failures discovered after delivery (e.g. warranty, returned goods, liability claims, penalties) Appraisal costs - costs of activities designed to ensure quality or uncover defects (e.g. in-line inspection, final inspection, field testing, crash test dummies, crumpled cars) Prevention costs - costs of preventing defects from occurring (e.g. training, working with vendors, quality control procedures, quality improvement programs, extra attention in design and production)
Continual Improvement Management Methods Total Quality Quality Circles Product Design Quality Guru’s W. Edwards Deming -14 point prescription for quality Joseph M. Juran -stressed management methods Armand Feigenbaum -quality as a “total field” - customer Phillip Crosby -quality is free, zero defects Kaoru Ishikawa -quality circles, problem solving methodology Genichi Taguchi -cost of poor quality, robust product design
Deming’s 14 Points 1 - Create constancy of purpose 2 - Adopt philosophy of prevention 3 - Cease mass inspection 4 - Select a few suppliers based on quality 5 - Constantly improve system and workers 6 - Institute worker training 7 - Instill leadership among supervisors 8 - Eliminate fear among employees 9 - Eliminate barriers between departments 10 - Eliminate slogans 11 - Remove numerical quotas 12 - Enhance worker pride 13 - Institute vigorous training & education programs 14 - Implement these 13 points
Quality Awards The Malcom Baldridge Award - The Malcolm Baldrige National Quality Award is the centerpiece of the Baldrige National Quality Program. This award, which since 1988 has been presented annually by the President to recognize performance excellence, focuses on an organization's overall performance management system. It does not certify product or service quality.
Categories For The Baldridge Award Business: Manufacturing companies or subsidiaries that produce and sell manufactured products or manufacturing processes or produce agricultural, mining, or construction products. Healthcare: Education:
Characteristics Of A Baldridge Winner The major characteristics of a Malcolm Baldridge Winner are companies/organizations who have: . formulated a vision of what they thought quality is and how they would achieve it. . senior management involvement . carefully planned and organized their quality effort to be sure it would be effectively initiated. . vigorously controlled the overall process. . 6
Criteria For The Malcom Baldridge Award The Baldrige Criteria for Performance Excellence is updated each year to provide a systems perspective for understanding performance management. They reflect validated, leading-edge management practices against which an organization can measure itself. With their acceptance nationally and internationally as the model for performance excellence, the Criteria represent a common language for communication among organizations for sharing best practices. The Criteria are also the basis for the Malcolm Baldrige National Quality Award process. The Criteria include leadership, strategic planning, customer & market focus, information & analysis, human resource development & management, process management and business results.
Criteria For The Malcom Baldridge Award Leadership - The organization’s leadership system and senior leaders’ personal leadership StrategicPlanning - How the organization sets strategic directions and how it develops the critical strategies and action plans Customer and Market Focus - How the company determines requirements, expectations, and preferences of customers and markets Information and Analysis - The selection, management, and effectiveness of use of information and data to support key company processes and action plans, and the company’s performance management system
Criteria For The Malcom Baldridge Award Human Resource Focus - How the company enables employees to develop and utilize their full potential, aligned with the company’s objectives Process Management - How key processes are designed, implemented, managed, and improved Business Results - The organization’s performance and improvement in key business areas
Quality Awards The Deming Prize - The Union of Japanese Scientists and Engineers(JUSE) invited Dr. Deming to Japan in July 1950. He held a series of lectures and seminars during which he taught the basic principles of statistical quality control to executives, managers and engineers of Japanese industries. His teachings made a deep impression on the participants' minds and provided great impetus in implementing quality control in Japan. In appreciation, JUSE created a prize to commemorate Dr. Deming's contribution and friendship and to promote the continued development of quality control in Japan. The prize was established in 1950 and annual awards are still given each year.
Quality Awards • Industry, regional, and company awards .Institute of Industrial Engineers • .NASA • .European Quality Award
Quality Certifications ISO - International Organization for Standardization - purpose is to promote worldwide standards that will improve operating efficiency, improve productivity, and reduce costs . Truly international in scope . Certification required by many foreign firms ISO 9000 series - quality management and assurance ISO 9001 ~ Suppliers and Designers ISO 9002 ~ Production ISO 9003 ~ Inspection and Test ISO 9004 ~ Quality Management ISO 14000 - environmental performance
ISO Accreditation • Europeanregistration • 3rd party registrar assesses quality program • European Conformity (CE) mark authorized • United States 3rd party registrars • American National Standards Institute - ANSI • American Society for Quality Control - ASQ • Registrar Accreditation Board - RAB
You Know It When You See It “quality is not something you inspect into a product/service, it is the result of the mental attitude of the person who is producing or delivering a product/service, either you have the mental attitude or you do not … if you do not, you can be trained to have it … some people choose to … some do not … at any rate, in your business careers it will be easy to spot those who have it and those who do not … you will know it when you see it” Hodges, 1998
Total Quality Management refers to the quest for quality that involves everyone in the organization. Two key philosophies: . Continual improvement . Customer satisfaction
Total Quality Management • TQM may be defined as managing the entire organization so that it excels on all dimensions of products and services that are important to the customer. . Marketing, sales, R&D • . Engineering • . Purchasing • . Personnel • . Management • . Packing, storing, shipping • . Customer service • Total Quality management is a broad concept rooted in the Deming philosophy. It involves the following concepts:
Process Design Product Design Customer Satisfaction Continuous Improvement Employee Involvement Decision Making Tools Purchasing Benchmarking Elements Of Total Quality Management . Determine what customer (target market) wants . Design a product to meet or exceed wants and make it easy to produce and easy to use . Design a production process to do it right the first time . Track results and use them to guide future improvements .Continuousimprovement - get a little better each day . Benchmarking - learn from those who do “it” best .Employeeempowerment - responsibility/authority at source .Teamapproach - spirit of cooperation, shared problem solving . Decisions based on facts rather than opinion . Knowledge of QualityTools/Methodologies.Supplierquality - make vendors part of your team
Training Presentation Group processes Implementation Data collection Monitoring Problem analysis Problem ID List alternatives Solution Problem analysis Problem results Consensus Cause & effect Brainstorming Data collection & analysis Shared Problem Solving – The Quality Circle Organization 8-10 members Same area Moderator
Three Sigma and Six Sigma Quality Statistical methodologies for achieving continual process improvement and reducing process variability • Basically these are the same concept which are designed to reduce process variability • Program designed to reduce defects • Requires the use of certain tools and techniques • Statistically process variability (standard deviation) is such that • Six sigma: no more than 3.4 defects per million • Three sigma: no more than 2.7 defects per thousand
1.35 ppt 1.35 ppt 1.7 ppm 1.7 ppm +/- 3 Sigma +/- 6 Sigma ppt – parts per thousand ppm – parts per million Three Sigma and Six Sigma Quality Product Upperspecification Product Lowerspecification Process Mean
Three Sigma and Six Sigma Quality Six sigma quality has gained popularity in recent years Six sigma teams are sanctioned by top management and are coordinated through program champions who work on the projects management deems most likely to succeed. Six sigma practitioners receive certifications as they gain knowledge and proficiency in the terminology and methodology (e.g. “green” and “black” belts. D – Define M – Measure A – Analyze I – Improve C – Control
Plan Act Do Study Process Improvement Steps Deming Wheel
Select a process Document Study/document Evaluate Seek ways to Improve it Implement the Improved process Design an Improved process Process Improvement Steps
Plan Act Do Study Process Improvement Steps Plan a change aimed at improvement .Define the problem and establish an improvement goal . Collect data (ProcessMapping) . Analyze the problem . Generate potential solutions . Choose a solution (RedesigntheProcess) Do. Implement the solution Study/Check. Monitor the solution. Did it work? Act. Institutionalize the change or abandon or do it again.
Plan Act Do Study Process Mapping ProcessMapping involves the following steps: . Collect information about the process, identify each step in the process, and for each step determine: .. The inputs and outputs, the people involved, all decisions that are made . Document such measures as time, cost, space used, waste, employee morale, employee turnover, accidents, safety hazards, working conditions, revenues, profits/(losses), quality and customer satisfaction . Prepare a flowchart of the process that accurately depicts the process with not too much or too little information .. Make sure that key activities and decisions are represented
Plan Act Do Study Process Mapping Once the information is collected: . Ask these questions about the process .. Is the flow logical? .. Are there any steps or activities missing? .. Are there any duplications? . Ask these questions about each step .. Is the step necessary? .. Does the step add value? .. Does any waste occur at this step? .. Could the time be shortened? .. Could the cost to perform the step be reduced? .. Could two (or more) steps be combined?
Plan Act Do Study Redesign The Process Using the results of the above steps, redesign the process if possible. . Document the improvements; potential measures include: .. Reductions in time, cost, space, waste, employee turnover, accidents, safety hazards, and increases/improvements in employee morale, working conditions, revenues/profits, quality and customer satisfaction
7 Basic Improvement Tools There are 7 basic tools available to assist the operations manager in the improvement process previously described. These tools help identify and quantify the opportunities for improvement. They include: . Check sheets . Flowcharts . Scatter diagrams . Histograms . Pareto Analysis . Control Charts . Cause and effect diagrams
Monday • Billing Errors • Wrong Account • Wrong Amount • A/R Errors • Wrong Account • Wrong Amount Check Sheets A checksheet is a simple tool for recording the reasons a process may not be performing as expected. It is a simple observational method which organizes and determines the frequency of reasons.
Process Flow Charts A Process Flow Chartis a simple tool for recording the sequence of steps and decision points in a process. The flow chart is very useful in analyzing a process to determine the strong and weak points in the process.
Process Flow Chart It usually follows that a more detailed process flow chart will allow for better understanding and better decisions. The process flow chart also identifies points where data should be collected to aid in the decision making process. Alarm goes off Yes Sleep Late No Get Dressed Eat Breakfast Go to Class Shower
Scattergram A scattergramis a simple graphical tool which can be used to identify the relationship between two variables. It can prove beneficial when setting parameters for activities within a process. 14,000 12,000 10,000 8,000 6,000 4,000 2,000 0 0 5 10 15 20 25 30 35 40 45
Number of defects Offcenter Smeared print Missing label Other Loose Histogram A histogramis a simple graphical tool which can be used to identify the frequency of a cause of variation. The histogram is the result of the process of identifying types of variation observed.
You’re a quality analyst for Corning Glass. You’ve collected data on 100 rejected glasses: Nicks 80 Cuts 11 Scratches 3 Porosity 3 Misc. 3 Pareto Chart A Paretochartis a histogram which shows the relative importance of problems or defects. It makes identifying and solving problems easier. It is based on the ParetoPrinciple which basically says most effects have relatively few causes and is sometimes referred to as the 80/20 rule (80% of the problems come from 20% of the causes (people, materials, machines, etc.)
# of Defects 100 80 80 60 40 11 20 3 3 3 0 Nicks Cuts Scratches Porosity Misc. Cause Pareto Chart Pareto Charts identify the major causes and suggest that if the major causes are solved first the quality will improve more than by solving the secondary causes.
Out ofcontrol UCL Mean LCL 0 1 2 3 4 5 6 7 8 9 10 11 12 13 14 15 Sample number Control Chart A ControlChartis a time series plot of a quality parameter used to indicate whether a process is in or out of control. Control charts are used to identify when a process is exhibiting random or non-random (assignable) behavior.
UCL UCL UCL LCL LCL LCL Additional improvements made to the process – variability improved Process not centered and not stable Process centered and stable Control Chart A ControlChartcan also be used to monitor improvements in a process.
Run Charts A RunChartis a tool to plot observations over a period of time.
Methods Materials Cause Cause Cause Cause Cause Cause Cause Cause Cause Cause Cause Cause Effect Environment People Equipment Ishikawa - Cause & Effect Diagram A Cause & Effect Diagram (fishbone diagram)is a graphical tool used to search for the causes of a problem. It is sometimes called a fishbone or Ishikawa diagram.