Download
1 / 26
270 likes | 489 Vues
An Overview of the Observations of Sea Level Change. NSCE 11 th Conference on Science, Policy, and the Environment: Our Changing Oceans. R. Steven Nerem University of Colorado Department of Aerospace Engineering Sciences Colorado Center for Astrodynamics Research

E N D
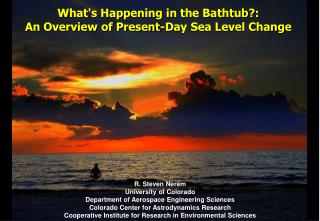
An Overview of the Observations of Sea Level Change NSCE 11th Conference on Science, Policy, and the Environment: Our Changing Oceans R. Steven Nerem University of Colorado Department of Aerospace Engineering Sciences Colorado Center for Astrodynamics Research Cooperative Institute for Research in Environmental Sciences
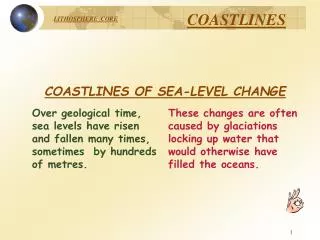
Why does sea level change?The Bathtub Model Ice Melt + Precipitation over Oceans Runoff from Continents Thermal Expansion - Evaporation from Oceans Precipitation over Continents
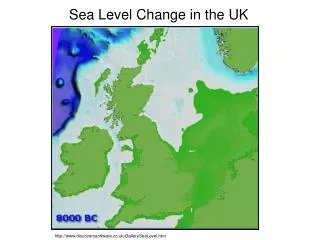
What is Global Mean Sea Level Change? • “Global Mean Sea Level Change” is the change in the average height of the oceans over the entire globe at a single point in time. • Sea level change at a specific location in the ocean may be higher or lower than the global mean because of differences in ocean temperature and other effects. • Does not include ocean tides, storm surge • Does not include effects of land subsidence, which locally can exacerbate the effects of sea level rise.
How do we measure sea level change? GRAVITY Argo
What do the tide gauges tell us? 3.2 mm/year Average Rate ~ 1.8 mm/year [Church and White, 2006]
What do the altimetersatellites tell us? Jason 1 & 2 TOPEX/ Poseidon Trend = 3.3 ± 0.4 mm/year
Greenland Ice Mass Changes from GRACE April, 2002 – June, 2010 Rate of Ice mass change: All Greenland: -239 Gt/yr South Greenland: -162 Gt/yr North Greenland: -77 Gt/yr Total Greenland ice volume (1 Gton = 1 km3 of water) -239 Gton/yr = 0.66 mm/yr sea level rise [Wahr, 2010]
Antarctica Ice Mass Variations from GRACE Total Antarctic ice mass April, 2002 – June, 2010 All Antarctica: -143 Gton/yr West Antarctica: -155 Gton/yr East Antarctica: +15 Gton/yr -143 Gton/yr = 0.40 mm/yr sea level rise [Wahr, 2010]
Is Antarctic Ice Mass Loss Holding Steady? [Wahr, 2010]
IceSat Surface Elevation Changes [Pritchard et al., 2009]
Alaskan Glaciers from GRACE Rate of mass change between April, 2002 and May, 2010 Rate of mass change: -55 Gton/yr = 0.15 mm/yr sea level rise . [Wahr, 2010]
Current Sea Level Budget Thermal Expansion: ~ 1 mm/year + Mountain Glaciers: ~ 1.1 mm/year + Greenland Ice Melt: ~ 0.6 mm/year + Antarctic Ice Melt: ~ 0.4 mm/year Land Water Storage: ? = Total: ~ 3.1 mm/year
Western Pacific Sea Level Change Merrifield (2010)
Predicted Regional Patternsof Sea Level Change from Ice Melt [Bamber, 2009]
What Will Happen in the Future? Empirical projections Rahmstorf, 2007 Coupled climate models IPCC, 2007
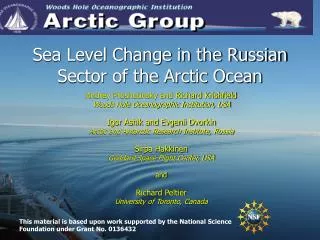
It can happen – because it has happened before The last time the Arctic was 3 to 5°C warmer than present, global sea level was ~6 meters higher than present [Clark, 2009]
Summary • Observations of sea level change are consistent with how we expect sea level to respond in a warming climate. • Sea level rose twice as fast in the last decade than over the last half of the 20th century. • Presently, ocean warming, melting of mountain glaciers, and melting of the polar ice caps are contributing in roughly equal amounts to the observed rise. • The large uncertainty in future sea level rise projections is due mainly to the uncertain contributions of Greenland and Antarctica, which appear to be accelerating. • Whether the current rate of rise is accelerating can only be resolved with longer satellite time series. • Many of the remaining questions about sea level rise can only be answered with continued satellite measurements, which have an uncertain future.