Download
1 / 22
220 likes | 350 Vues
USDA/NASS: Programs and Census of Agriculture. Washington State Conservation Commission 9/18/14. NASS MISSION. The National Agricultural Statistics Service provides timely, accurate, and useful statistics in service to U.S. agriculture. CENSUS OF AGRICULTURE.

E N D
USDA/NASS: Programs and Census of Agriculture Washington State Conservation Commission 9/18/14
NASS MISSION The National Agricultural Statistics Service provides timely, accurate, and useful statistics in service to U.S. agriculture.
CENSUS OF AGRICULTURE A complete count, taken every five years, of America’s farms and ranches and the people who operate them.
CENSUS HISTORY The first Census of Agriculture was conducted in 1840 in 26 states and the District of Columbia.
“FARM” DEFINED Any place from which $1,000 of agricultural products were produced and sold, or normally would have been sold, during the Census year.
CENSUS OF AGRICULTURE • The most complete agricultural data available. • The only source of uniform, comprehensive and objective information for every county in the nation. • Information on land use and ownership, operator characteristics, production practices, income and expenditures, and more.
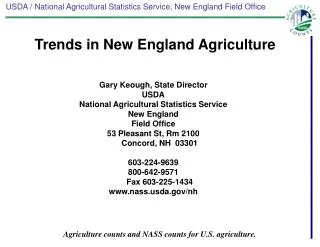
WASHINGTON HIGHLIGHTS Market Value of Agricultural Products Sold ($1,000) * * Market value of agricultural products sold does not include payments received for participation in other federal farm programs.
WASHINGTON HIGHLIGHTS 2012 Number of Farms by Economic Class
INTERESTING (to me) FACTS • #6 – WA Rank in US for the Number of Beginning Farmers 10 years and less – 30% • 1,243 of WA’s 37,249 farms account for 75% of sales • 41% of farms <$1000 sales – “Point Farms”
FULL CENSUS REPORT • Online at www.agcensus.usda.gov • Searchable database • Full publication • Charts/maps
OTHER CENSUS PRODUCTS Other census products that were or will be released in 2014 include: • State and County Profiles – May • Congressional Districts Profiles - July • Congressional Districts Rankings - July • REG Profiles - August • American Indians - August • Organic Production - September • Watersheds - November • Farm Typology - December • Specialty Crops - December
SUPPLEMENTAL SURVEYS Other census products that will be released in 2014 include: • Census of Aquaculture • Released September • Farm and Ranch Irrigation Survey • Released October
Thank You. Questions??