The Biosphere
340 likes | 530 Vues
The Biosphere. Sub topic (a) Investigating an Ecosystem. Name. Teacher. Investigating an Ecosystem. Examples of ecosystems include a woodland , ocean , desert , moorland etc.. The main parts of an ecosystem are the habitats , animals and plants. ocean. woodland. desert.

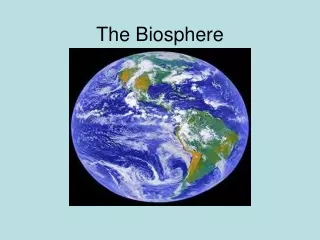
The Biosphere
E N D
Presentation Transcript
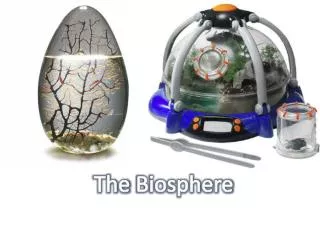
The Biosphere Sub topic (a) Investigating an Ecosystem Name Teacher
Investigating an Ecosystem • Examples of ecosystems include a woodland, ocean , desert, moorland etc.. • The main parts of an ecosystem are the habitats, animals and plants ocean woodland desert
Parts of an ecosystem • Habitat – the place where an organism lives • Population – a group of organisms of one species • Community – all the organisms living in a habitat • Ecosystem – all the living things and their environment
Investigating an Ecosystem • There are many habitats within an ecosystem. • E.g. in a woodland there are many layers and within these layers many different habitats such as trees, leaves (dead and alive), shrubs, bushes, soil, etc..
Taking a sample • We could find out exactly what is living in a particular ecosystem by collecting and counting all the organisms. • This would be difficult and would take a long time. • However, we can get some idea of the numbers and types of living things in an ecosystem by taking a sample.
Using a Quadrat • In order to sample plants (and slow moving animals) we can use a quadrat. • A quadrat marks off a small piece of ground of known area so that different plants present within this sample can be identified and counted or their area of cover estimated. • This sample gives us an idea of the number and types of organismpresent in the whole area.
Using a Quadrat • The quadrats we use are 0.25m2 and sub-divided into 25 smaller squares. • The quadrat is placed randomly on the ground. • The number of small squares containing the plant we are interested in are counted. • This is called the abundance estimate.
Measuring Abundance Daisies = 9 Dandelion = 11 Plantain = 7 Buttercup = 4
Minimising errors (C) • To minimise errors and make your sample more reliable and representative • Use many quadrats • Use quadrats randomly
Pitfall traps • Pitfall traps are used to trap small animals moving across the surface of the ground. • To minimise errors (Credit) • Use many pitfall traps • Inspect them regurarly
Other sampling Techniques • Sweep netting is used to catch small animals living in bushes and small trees. • Pond nets are used to catch animals living in ponds. • Tullgren funnels are used to remove tiny organisms from soil samples. • Pooters are used to capture small insects.
Pond Net • The pond net is held downstream and organisms are dislodged by kicking the bed of the stream • Pond nets let water pass through them but trap small aquatic organisms
Tullgren Funnel • The soil organisms move out of the soil away from the light / heat • The soil organisms drop into the collecting container
Pooter The pooter is used to ‘suck’ small insects from trees and bushes
Estimating Total Numbers • We can estimate the total numbers of organisms living in a certain area. • We can use a metre quadrat • We need to calculate the area we are sampling. 1m 1m
Estimating Total Numbers • We need to estimate numbers using a metre quadrat • We then calculate an average number of organisms per quadrat. • We then work out how many quadrats fit into the specified area and multiply this number by the average number of organisms per quadrat.
15m 40m Estimating Total Numbers • Calculate the area of this field. • Length x breadth.
Estimating Total Numbers • We now know the area of the field is: • 15 x 40 = 600m2. • We now need to sample the field by using the quadrat , say 10 times. • The quadrat is then placed randomly in 10 different spots in the field, and the number of plants counted. • Suppose we are measuring daisies.
15m 40m Sampling Daisies The quadrats are placed randomly and the number of daisies in each are counted.
Sampling Daisies • The results are collected and recorded. • We then calculate the average number of daisies per quadrat. • Add up the number of daisies column and divide by the number of sites.
Sampling Daisies • In this case the total number of daisies sampled was 90. • The number of sites was 10. • Therefore the average number of daisies per site is 90 ÷ 10 = 9 daisies • We now need to work out how many quadrats fit the field.
Sampling Daisies • The field is 600m2 and each quadrat is 1m2. • Therefore, the field is 600 x 1 = 600 quadrats. • If there are, on average 9 daisies per quadrat, this means there are • 9 x 600 = 5400 daisies in the field. • A good estimate.
Estimating Total Numbers • Here is one for you to try on your own. • This time we are estimating the number of worms in a field using 0.25m2 quadrats. • Here are the results.
25m 40m 25 m Estimating Total Numbers 50m
How did you do? • Average number of worms per quadrat? • Answer – 7 worms per quadrat. • Total area of field? • Answer – (50 x 40) – (25 x 15) = 1625m2 • Total number of quadrats in field? • Answer - 1625 x 4 = 6500 quadrats • Total number of worms? • Answer – 6500 x 7 = 45 500 worms
Factors Affecting Distribution • There are many different factors in an ecosystem which affect the lives of organisms. • The factors are also responsible for the distribution of the organisms, i.e. where they live. • Some of these factors – the abiotic factors – are easy to measure, e.g. light, moisture, temperature.
Biotic factors • Factors in the ecosystem related to living things are called Biotic Factors. • Examples of these are the amount of food, disease, the amount of grazing and hunting.
Abiotic Factors • Non-living factors in the ecosystem are called Abiotic factors. • Examples of these are temperature, moisture, light intensity, pH
Biotic / Abiotic Factors • Are the following factors biotic or abiotic ? • Predators • Rainfall • Temperature • Wind • Competition • Fishing • Hunting • Daylength • pH • Disease • Oxygen biotic abiotic abiotic abiotic biotic biotic biotic abiotic abiotic biotic abiotic
Measuring Abiotic Factors • We can measure light intensity using a Light meter. • Make sure you don’t cast a shadow on the meter or you will get a false reading. (Credit) • To reduce error repeat readings many times and take an average (Credit)
Measuring Abiotic Factors • We can measure moisture using a moisture meter. • To minimise errors(Credit) : • Carefully push the probe vertically into the soil to a depth of 4cm. • Wipe the probe dry between readings • Take many readings then calculate an average
1 2 3 4 5 6 7 8 9 10 Sample sites Line Transect (C)
Line Transect (C) • In this example the light intensity would decrease as you move from site 1 to 10. • The moisture readings would increase as you move from site 1 to 10. • Therefore, the distribution of plants are different – i.e. there are likely to be more daisies at site 1 than site 10. • Likewise there are likely to be more woodlice at site 10 than at site 1.
Scientist studying Distribution of organisms (C) The scientist in the picture is studying the distribution of organisms on a coral reef The distribution of organisms would be affected by abiotic factors such as temperature or wave action