Impact Measurement Project
320 likes | 357 Vues
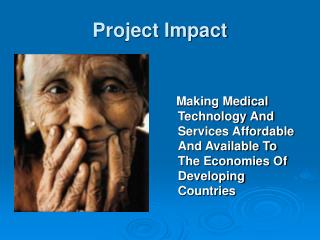
The Childhood Trust aims to alleviate child poverty in London through funding and expertise for projects in practical, emotional, and inspirational support. This impact measurement project helps evaluate funded projects' success to inform future decisions and attract new donors.

Impact Measurement Project
E N D
Presentation Transcript
Impact Measurement Project
Child Poverty in London • More than 600,000children in London live in severe poverty • Two in five of the UK’s children living in poverty are living in London. • London has the fourth highest rate of child poverty among the world’s richest cities. • Children who suffer from poverty and deprivation are more likely to become susceptible to: • poor health and shorter life expectancy; • learning difficulties; • truancy and exclusion from school; • anti-social behaviour; • drug abuse; • teenage pregnancy; and • future unemployment.
The Childhood Trust The aim of The Childhood Trust is to: “Alleviate child poverty in London by supporting best in breed community groups/small charities with funding and expertise for projects covering themes of Practical, Emotional or Inspirational support” The Childhood trust funds and facilitates projects that demonstrably improve the lives of disadvantaged children by channelling funding into 3 thematic areas: • Practical - Ensuring that children have access to the basic necessities • Emotional - Offering emotional support and motivation to break the cycle of poverty • Inspirational - Providing opportunities to try new experiences and develop new skills
The Impact Measurement Project Volunteers from the OR society were commissioned by The Childhood Trust to develop an impact measurement framework. The main drivers for this work are: • To enable The Childhood Trust to improve its understanding of which projects/ type of projects funded in previous years have had the greatest positive impact on alleviating child poverty in London. • To provide The Childhood Trust with the information required to inform future business planning decisions, to ensure funding is directed towards those projects most likely to achieve the greatest positive impact in future years.
Objectives of the project • To develop a suite of impact measures or benchmarks to feed into an impact measurement framework that The Childhood Trust can use to evaluate the success of past projects. • To assist The Childhood Trust to make informed decisions when selecting future funding projects that are most likely to result in positive outcomes. • To ensure that The Childhood Trust is achieving its objectives by ensuring that funding is distributed to the ‘right’ projects throughout the themes of Practical, Emotional and Inspirational support. • To provide The Childhood Trust with the information required to leverage future funding from new (big) donors. • To help The Childhood Trust to increase its visibility and be seen as an innovative charity/funding body.
Approach The project team investigated various approaches for project development by researching best practise across the private, public and third sectors. This included: • Impact measurement reports developed by other charitable organisations; • The outcomes of previous OR society volunteer projects; and • Performance frameworks developed for small government agencies. The project team proposed the development of an Impact Report which would incorporate infographics to illustrate key statistics. It was proposed that where data availability was sufficient, appropriate charts and graphs would also be included in the report. It was agreed with The Childhood Trust that the report should be light touch and easy to understand by the charity’s beneficiaries, funders and other stakeholders.
Data availability To determine the best approach for implementation, the project team investigated possible data sources for use in development of the Impact Measurement Framework. Options considered included: • Existing financial data from The Childhood Trust records; • Data on the funded charities from the Charity Commission Website including details of the London borough in which the charities operate and specifics relating to their annual income and spend; • The annual reports of the larger of the funded charities; • Data documenting the number of children who benefit from each project as a result of charity ‘safeguarding rules’; and • The design and development of a questionnaire sent out to The Childhood Trust funding recipients to collect the requisite data.
Questionnaire • Following consultation with The Childhood Trust staff, the project team designed a questionnaire to send out to all 24 recipients of funding via the 2013-14 Big Give. • The questionnaire was designed in Survey Monkey and sent out from The Childhood Trust to maximise the response rate. • In January 2015, the questionnaire was sent out to four of the recipient charities who have the strongest relationship with The Childhood Trust in order to test the questions and responses. • Minor amendments were made to take on board feedback from the test charities before the finalised questionnaire was sent to the remaining 20 charities in February 2015. • Charities were contacted by The Childhood Trust staff in advance of receiving the questionnaire to maximise engagement and offered an incentive of £25 for complete responses received by a set deadline. • The questionnaire response rate was 58%.
Our supported charities We supported 28 charities in 2013-14 24 + 4 We expect this to increase by 29%in 2014-15 In 2013-14 we supported charities in All London Boroughs In 46%of charity partners supported via The Big Give, our matched funding accounted for at least 10% the charity’s annual income.
The children who benefited On average 646children were supported per project for charity partners that completed the survey Match funding accounted for 11%children supported by charity partners as a whole Number of children supported by theme No. Children
The ages of children who benefit Charity partners that completed the survey support children of the following ages
How children are referred Charity partners that completed the survey refer children through the following channels 57% of charity partners that completed the survey target children through referrals 36% of charity partners that completed the survey apply their own eligibility criteria to refer children 14% Health Care Professionals 43% Schools 29% Parents 21% Social Services
The intended benefits of our supported charities Charity partners that completed the survey intended to make improvements in the following areas in 2013-14 86% Emotional Wellbeing 36% Economic Wellbeing 50% Education attainment gap 36% Other 36% Avoiding Crime 43% Employment 36% Literacy/ Numeracy * On average each charity planned to achieve benefits in 3.21 areas.
Theory of Change Charity partners were asked if they have a Theory of Change. Of those that completed the survey:
Impact through Social Media Charity partners that completed the survey publicise the work we fund through the following Social Media channels 100% of charity partners that completed the survey used social media to raise awareness of work that we funded in 2013-14 85% 92% 0% 15%
Quotes from supported charities “The Childhood Trust was extremely supportive and encouraging. It was great to work with you.” “Thank you, it has impacted the lives of several of our members significantly and I hope that we can continue a good relationship going forward to help other young people.”
Where the charity partnerswe support operate • Maps using data: • Office of National Statistics (ONS) data on child poverty in London Boroughs • Funds provided by The Childhood Trust • The London Boroughs where the charity partners operate • Assumptions • Child poverty rates are “after housing costs”. • It is assumed that each charity partner spends funds uniformly across the boroughs where they operated.
Number of Charity Partners in each London Borough with Child Poverty Rate
Project Objective • The project questionnaire included the following: • Thinking about the impact your project has made on children's lives, how have you measured this? • The objective is to identify best-practice and encourage its use across the charity partners.
How the charities we support measure their impact 79% of charity partners that completed the survey are prepared to share examples of impact measurement 50% of charity partners that completed the survey have been selected for a review of examples of impact measurement What we know: Charity partners that completed the survey reported the following (on how they measure impact): 14% Metric with Improvement Target 29% Metric only 43% Mechanism to collect data 14% Described activities
Metrics described (From 6 Charity Partners) • Numbers of children {doing something positive / not doing something negative}. • Improved self-confidence. • Educational performance / progress. • Change of attitude. • Emotional well-being. • Reduced involvement with negative peer groups. • Increase aspiration. • Throughput (i.e. simple count of number of children attending). Encouraging that metrics assess the impact on individuals (reported collectively) – rather than simply “throughput”.
Mechanisms to collect data • Observation • Interviews • Educational performance / progress • Self-reporting • Feedback forms / surveys • Feedback from Police There’s no description of how this data is used to derive an impact measure (although it presumably is).
Suggested Desired Outcomes • Partner charities think in terms of measurement (indicators) when thinking about Impact. • The standard of Impact measurement (conducted by partner charities) is raised to that of the best (of the existing measurement). • A standard set of Impact Measurement tools (measures and methods) are identified that can be used by many charity partners (possibly grouped by activity). The Trustees were invited to endorse these outcomes.
Impact Measurement Next Steps • Review examples of impact measurement to be shared by selected charity partners. (That is, examples selected for review – as a follow-up from the questionnaire.) • Address any comments / issues / questions arising from this meeting. • Generate recommendations for on-going assessments (by The Childhood Trust). • Consider linking Impact measurement to: • Each Theory of Change • Eligibility criteria (for accepting children onto a project)
Options for Consideration • Any of the data we have presented can be used to consider/prioritise future funding options, that is: • Proportion of charity partner funding from The Childhood Trust • Number of children by Theme • Ages • Referral / eligibility criteria (to accept children onto projects) • Benefit by “Aspect” (Economic/Emotional/Educational(x2)/ avoiding crime / employability / other) • London Borough • Theory of Change The trustees have been invited to consider these points.
Project team Malcolm Fenby malcolm.fenby@btinternet.com Joanna Ziff joziff@hotmail.com