Download
1 / 21
210 likes | 311 Vues
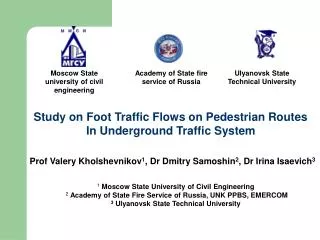
M oscow S tate university of civil engineering. Academy of State fire service of Russia. Ulyanovsk State Technical University. Study on Foot Traffic Flows on Pedestrian Routes In Underground Traffic System. Prof Valery Kholshevnikov 1 , Dr Dmitry Samoshin 2 , Dr Irina Isaevich 3.

E N D
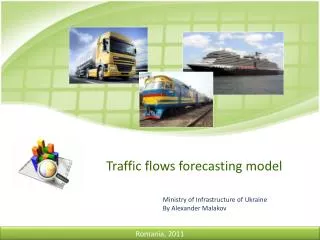
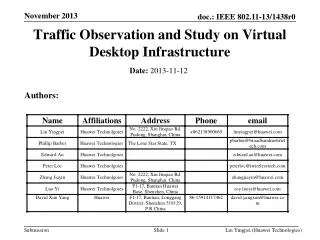
Moscow State university of civil engineering Academy of State fire service of Russia Ulyanovsk State Technical University Study on Foot Traffic Flows on Pedestrian Routes In Underground Traffic System Prof Valery Kholshevnikov1, Dr Dmitry Samoshin2, Dr Irina Isaevich3 1Moscow State University of Civil Engineering 2Academy of State Fire Service of Russia, UNK PPBS, EMERCOM 3Ulyanovsk State Technical University
Study outline: • Moscow underground traffic system: • 9 millions of passengers daily: • normal operation gives max load (compare to emergency evacuation): simultaneous multidirectional pedestrian movement: contra flows, flows crossings; • issues under discussion: • particular technique of actual observations; • relations between travel speed and density of human flows; • metro car traffic capacity and station platform design; • a mutual impact of escalator installations and pedestrian flows on efficiency of daily operation; • an impact of automatic turnstile on evacuation route traffic capacity;
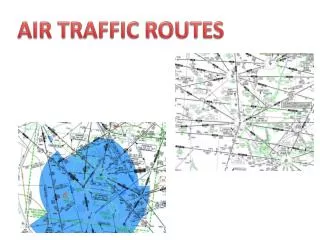
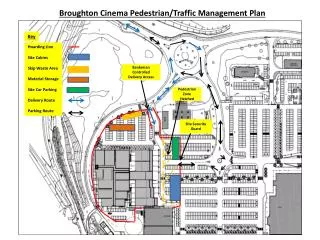
Traffic routes in underground station Ticket hall Entrance Trains Platform Station hall Escalators Ticket control Platform Trains Bridge to changing station Blue arrows – towards trains Green arrow – towards exits
Data sample volume 5957 counts total: 3380 – travel speed measurements at different flow density range; 1379 – escalator traffic capacity depending upon flow density and flow speed; 396 – ticket machines traffic capacity; 301 – “widening” flows; 261 – flow density on platform; 244 – car door traffic capacity;
Methods of actual observations – video analysis Scale grid drawing Videotape analysis based on scale grid. An example.
Travel speed (without density impact). Empirical data. Rush-hour Non Rush-hour Average free travel speed 106.2 m/min Average free travel speed 69.4 m/min
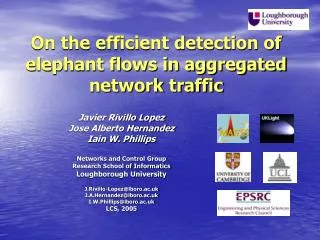
Travel speed and emotional state Active Of increased activity Quiet Relationship between emotional state and activity: 1 – attention; 2 – control; 3 – activity. Relation between unimpeded travel speed and psychological stress level
Rush-hour – “Of increased activity” category Non Rush-hour – “Active” category
General law for V=f(D) Horizontal plane Stairs downward V, m/min V, m/min -is the average travel speed of pedestrians in a flow, m/s; -is the average travel speed of pedestrians on a route without the influence of density, m/s; aj -is an empirical constant for each type of pathway); Di -is the prevailing density of the flow, persons/m2 (or m2/m2); Doj -is a threshold value of flow density on the j-the pathway, persons/m2 (or m2/m2 if pedestrians are measured based on their horizontal projection) ); E -is an indicator of the emotional state of the pedestrian (the category of movement); J -is an indicator of the type of route traversed; D, person/m2 D, person/m2 Stairs upwards Door opening V, m/min V, m/min D, person/m2 D, person/m2
Parameters of pedestrian flow used in Russian building codes for emergency evacuation
Relation between travel speed, emotion level and density of flow in underground traffic system. V, m/min Of increased activity V=106.2*(1-0.4*Ln(D/0.56)) Active V=69.4*(1-0.4*Ln(D/0.65)) D, persons/m2
Pedestrians on platform Camera marks Pedestrians Camera • Car door traffic capacity – 50 persons/min (at door width 1.2m); • Max platform density – 5 persons/m2; • Comfortable inter-person distance: face to face – 0.49m, face to back – 0.58m, side by side – 0.8m.
Movement through escalator 1 – station hall; 2 – movement through escalator’s guiding handrails; 3 – handrailsin front of escalator;4 – escalator entrance; 5 – escalator.
Pedestrian flow in front of escalator t=0.15 min t=2.02 min t=4.20 min Trains: 500 pers Escalator Station hall
Escalator traffic capacity Maximum escalator traffic capacity obtained at close values between pedestrian speed 42.37 m/min (at density 5 persons/m2) and escalator speed 42 m/min (0.7 m/sec)
Movement through ticket machines Ticket machines Area of observation Passengers In rush-hour 17.00-19.00 and normal operation 15.00-16.00 time to overcome ticket machines, their traffic capacity and flow density impact were investigated
Time losses moving through ticket machines Flow density and psychological state impact passage time: the higher the density the more time takes to pass through ticket machine due to physical contacts between people and stress factor. In normal condition at 2-3 persons/m2 time decreases because passengers aimed to overcome uncomfortable type of route. Average traffic capacity is 1187 persons per hour.
Pedestrian flow modeling Based of study results, valid computer programs were developed. On this diagram, comparison of actual observation and flow modeling at control point is presented.
Distinguishing features of pedestrian movement in underground traffic system 1. Seasons (i.e. winter, summer etc) do not influence pedestrian movement. 2. Psychological state of pedestrians (i.e. rush-hour, normal conditions) change parameters of their movement. 3. Rush–hour movement fit “of increased activity movement” category of movement, and non-rush hour movement fit “active” category of movement. 4. Pedestrians in rear of the flow moves in “quiet” category of movement in rush hour and in normal conditions. Pedestrians in head of flow moves in “of increased activity” category of movement in rush hour and in normal conditions 5. It was noticed “widening” of the flow as they exit on a wide hall. Flow widening caused with pedestrian intention to move in a low density extending length of their route. Balance between uncomfortable movement in a dense flow and roundabout route observed at density value about 1,2 pers/m2 (range 0,3-1,9 pers/m2) – flow does not widening any more.
General conclusions • Observations were undertaken on all consecutive route sectors based on unified technique and analytical methods aimed to get the most precise data. • Experimental data were fully statistically treated in each density range. • Unimpeded travel speed (i.e. without density impact), as an indictor of emotional state, confirmed established earlier scale of emotional states (categories of movement) and relation between parameters of pedestrian flow based on Weber-Fechner law. • Reliable data, describing human flows development and movement were obtained during these experiments. Validated against available data computer models were also developed and they used in practice nowadays.
Computer model ADLPV (Analysis of Pedestrian Flow, Probability) Basic equations Changes in consequent time intervals Density of flow: Number of pedestrians, passing to next sector of route: Transition travel speed: Transition time: