Download
1 / 17
170 likes | 342 Vues
statistical power of mass hierarchy measurement (with ORCA) Aart Heijboer, Nikhef. Computing oscillations probabilities. Oscillation probability given by P ab = |F ab | 2 with F the transition matrix is the flavour basis. 6. 5. 4. F = U V 6 V 5 V 4 V 3 V 2 V 1 U -1

E N D
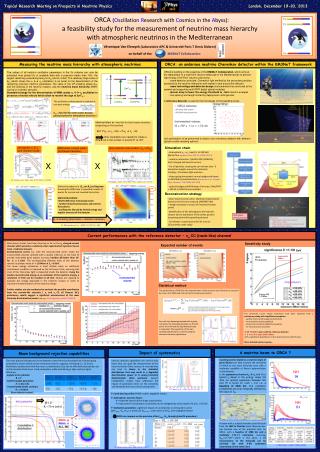
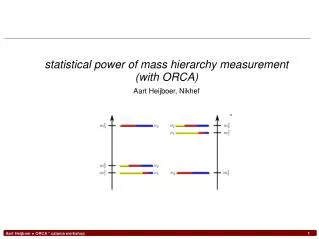
statistical power of mass hierarchy measurement (with ORCA) Aart Heijboer, Nikhef
Computing oscillations probabilities Oscillation probability given by Pab = |Fab|2 with F the transition matrix is the flavour basis 6 5 4 F= U V6 V5 V4 V3 V2 V1 U-1 The product of transition matrices computed for a matter of constant density ri. 3 2 • several options to compute exp in practice • Cayleigh-Hamilton formalism (hep-ph/9910546) • Diagonalize H • power series for exp. Cross-checked with published plots and 'Globes' package. all methods agree
assumed zero Inputs for oscillations probabilities taken from most recent global-data fit Arxiv:1205.5254 note allowed ranges are not identical for NH and IH → taken into account in the following plots
Oscillation probability (m → m) for straight up NH/IH difference largely degenerate with change in Dm2large beware: there are also plots around which accidentally exaggerate the NH/IH difference by comparing the central value or NH with a IH curve at the ~1 sigma edge of the allowed global fit.
Other zenith angles... effect is fairly large, but... almost opposite for anti-neutrinos will be washed out by E- and angle resolutions next step: compute realistic event rates
Interaction rates : ingredients neutrino fluxes (Bartol), include ne cross-sections from integrating DIS formula(approximates to ~20% genie and measurements) cross-sections
Adding detector effects • This is where the guess-work starts; all results depend crucially on these assumptions • assume zenith angle muon is measured perfectly. resolution comes for angle between n and m • Neutrino energy resolution: assume 25% requires reconstruction of muon and hadronic shower • Acceptance: • neutrino vertex inside instrumented volume • require 15 hits(educated guess: need direction, E-resolution, • rejection of atm. muons.). assumed detector: (100m)3 =1Mton 6x6 strings 20 oms/string geant4 sim with full photon tracking
after accounting for assumed detector resolutions: • maximum rate difference between NH and IH ~10% • to be compared to other uncertainties (e.g. on mixing angles and masses → next slide). difference between NH(central values from global fit) and IH (central values from global fit)
effect of parameter uncertainties : NH each plot compares central values with +1 sigma variation in each parameter → cannot be neglected: need to deal with these (nuisance) parameters
(Optimal) analysis to distinguish NH and IH Optimal observable to distinguish between NH and IH hypotheses = Maximum likelihood rato So this means, for each pseudo-experiment (data): 1. assume NH and find by maximizing (this involves computing many smeared-oscillograms for NH) 2. do the same for IH 3. compute The likehood contains a gaussian constraint representing the current knowledge from the global fit Dm221 and q21 are fixed in the fit to gain speed
Results of parameter fit on (NH) peudo-experiments fitted value true value drawn from global-fit-allowed range ORCA can improve the current uncertainty for Dm2large & q23 already with 1 year of data s(q13) still dominated by other data(via Gaussian constraint in the likelihood) after 10 Mtonyr → ORCA not very sensitive to it.
likelihood ratio distribution... ...for toy experiments in which the true hierarchy is normal or inverted. remember: results depend crucially on assumptions on resolution and detector layour and acceptance
likelihood ratio distribution for toy experiments in which the true hierarchy is normal or inverted. remember: results depend crucially on assumptions on resolution and detector layour and acceptance. expressed in sigma's, separation betweenNH and IH = 3 sigma with 10 Mton x year.
Conclusions / thoughts • Full toy analysis set up, including oscillation fit • good sensitivity to Dm2large & q23 before we can do MH • Determining MH is not an easy measurement • For assumed detector performance, need 10 Mton x year for 3 sigma • Of course, assumptions could be pessimistic • Still several sources of systematic to be accounted for • (earth density, rate normalization, cross-sections,....) • Determining the mass hierarchy with this type of detector requires Large instrumented volume (1 Mton is not enough ) • When we have full simulation and reconstruction, we should investigate sparse (or variable-density ) detectors • ( But demands on (energy) reconstruction quality are very high )