Download
1 / 89
920 likes | 1.09k Vues
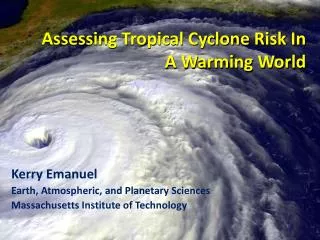
TROPICAL CYCLONES IN A WARMING WORLD. Kerry Emanuel Massachusetts Institute of Technology. Issues. What processes control rates of formation of tropical cyclones? What processes control the actual and potential intensity of TCs?

E N D
TROPICAL CYCLONESIN A WARMING WORLD Kerry Emanuel Massachusetts Institute of Technology
Issues • What processes control rates of formation of tropical cyclones? • What processes control the actual and potential intensity of TCs? • What have TCs been like in the past, and how will they be affected by global warming?
Global Tropical Cyclone Frequency, 1970-2008 Data Sources: NOAA/TPC and NAVY/JTWC
Tropical Cyclones Often Develop from Cloud Clusters:When/Why Does Convection Form Clusters?
Simplest Statistical Equilibrium State:Radiative-Convective Equilibrium
Vertically integrated water vapor at 4 days (Nolan et al., QJRMS, 2007)
Vertically integrated water vapor at 4 (a), 6 (b), 8 (c), and 10 (d) days (Nolan et al., QJRMS, 2007)
Empirical Necessary Conditions for Self-Aggregation (after Held et al., 1993; Bretherton et al., 2005; Nolan et al.; 2007) • Small vertical shear of horizontal wind • Interaction of radiation with clouds and/or water vapor • Feedback of convective downdraft surface winds on surface fluxes • Sufficiently high surface temperature
Self-Aggregation is Temperature-Dependent (Nolan et al., 2007; Emanuel and Khairoutdinov, in preparation, 2010)
Extension to f-plane Distance between vortex centers scales as Vpot/f
Atlantic Sea Surface Temperatures and Storm Max Power Dissipation (Smoothed with a 1-3-4-3-1 filter) Years included: 1870-2006 Power Dissipation Index (PDI) Scaled Temperature Data Sources: NOAA/TPC, UKMO/HADSST1
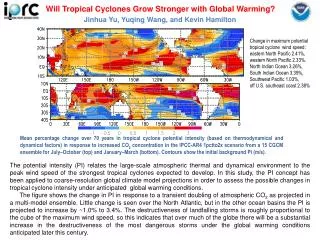
Tropical cyclone power dissipation has nearly tripled since the 1980s, though there has been an increase of only 0.5o C in sea surface temperature
Analysis of satellite-derived tropical cyclone lifetime-maximum wind speeds Trends in global satellite-derived tropical cyclone maximum wind speeds by quantile, from 0.1 to 0.9 in increments of 0.1. Box plots by year. Trend lines are shown for the median, 0.75 quantile, and 1.5 times the interquartile range Elsner, Kossin, and Jagger, Nature, 2008
The Importance of Potential Intensity for Genesis and for Storm Intensity
Theoretical Upper Bound on Hurricane Maximum Wind Speed: Surface temperature Air-sea enthalpy disequilibrium Ratio of exchange coefficients of enthalpy and momentum Outflow temperature s0* = saturation entropy of sea surface sb= actual entropy of subcloud layer
Condition of convective neutrality: sb = s* of free troposphere Also, s* of free troposphere is approximately spatially uniform (WTG approximation) approximately constant What matters, apparently, is the SST (s0*) relative to the tropospheric temperature (s*)
Empirical Evidence for the Importance of Potential Intensity to TC Genesis: A Genesis Potential Index (GPI) • 850 hPa absolute vorticity (h) • 850 – 250 hPa shear (S) • Potential intensity (PI) • Non-dimensional subsaturation of the middle troposphere: Base choice of predictors on physics, intuition, past experience
New Genesis Potential Index: • 850 hPa absolute vorticity (h) • 850 – 250 hPa shear (S) • Potential intensity (PI) • Non-dimensional subsaturation of the middle troposphere:
Climate Control of Potential Intensity Ocean Surface Energy Balance:
Potential intensity is determined by local radiative balance, local convergence of ocean heat flux, local surface wind speed, and local outflow temperature only • Remote influences limited to remote effects on surface wind surface radiation ocean heat flux and, in marginal zones, on outflow temperature • SST cannot vary independently of free atmospheric temperature on long time scales
Interpretation of Recent Trends in Potential Intensity North Indian Western North Pacific Southern Hemisphere North Atlantic Eastern North Pacific From NCAR/NCEP reanalysis data, 1980-2008
Potential intensity has been increasing by about 12 ms-1K-1, compared to accepted value of 4 ms-1K-1. What is the source of this discrepancy?
Answer: Potential Intensity is not a function of SST per se Showing potential intensity vs. SST, varying mean surface wind (blue) and CO2 content (green)
Combine expression for potential intensity, Vmax, with energy balance of ocean mixed layer: Net surface radiative flux SST Outflow T Ocean mixed layer depth Mixed layer heat flux Drag coefficient Mean surface wind speed Valid on time scales > thermal equilibration time of ocean mixed layer (~ 2 years)
Surface wind speeds have not changed much since 1980. Key variable: Outflow temperature, which in general decreases with: • Increasing SST • Decreasing temperature of lower stratosphere and/or troposphere transition layer
Importance of Trends in Outflow Temperature From NCEP Reanalysis
But AGCMs, driven by observed SSTs, do not get the cooling! August-October outflow temperatures averaged over the Atlantic MDR from the ECHAM 5 simulation (green), the NOAA/CIRES 20th Century reanalysis, version 2 (red) and the NCAR/NCEP reanalysis (blue)
As a result, they miss the recent increase in potential intensity NCEP # 31: ECHAM without aerosols #32: ECHAM with aerosols
1979-1999 Temperature Trends, 30S-30N. Red: Radiosondes; Solid Black: Mean of Models with Ozone; Dashed Black: Mean of Models without Ozone (Cordero and Forster, 2006)
Ozone may not explain spatial pattern of cooling(Fu and Wallace, Science, 2006)
Our Approach to TC Downscaling • Step 1: Seed each ocean basin with a very large number of weak, randomly located vortices • Step 2: Vortices are assumed to move with the large scale atmospheric flow in which they are embedded • Step 3: Run a coupled, ocean-atmosphere computer model for each vortex, and note how many achieve at least tropical storm strength; discard others • Step 4: Using the small fraction of surviving events, determine storm statistics.
New Downscaling Technique: 200 Synthetic U.S. Landfalling tracks (color coded by S-S Scale)
Cumulative Distribution of Storm Lifetime Peak Wind Speed, with Sample of 2946Synthetic Tracks
Year by Year Comparison with Best Track and with Knutson et al., 2007
Application to Re-analyses and AGCMs Annual Atlantic tropical cyclone counts: Unadjusted best-track data (black); and downscaled from the NCAR/NCEP reanalysis, 1980-2008 (blue), the ECHAM 5 simulation, 1870-2005 (green), and the NOAA/CIRES reanalysis, 1891-2008 (red). Thin lines show annual values, thick lines show 5-year running means