Download

1 / 13
130 likes | 313 Vues
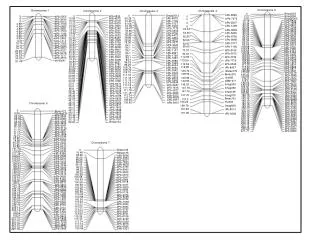
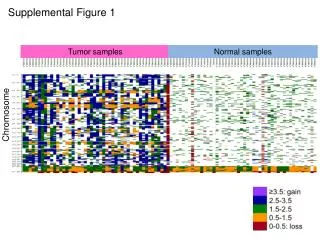
Supplementary Figure 1: Position of the QTLs involved in the study for the 11 traits with more than 20 QTLs each. Distances on the map are in Mb. The color legend is given under each figure but the trait colors, automatically determined by the software, may change from one figure to the other.

E N D
Supplementary Figure 1: Position of the QTLs involved in the study for the 11 traits with more than 20 QTLs each. Distances on the map are in Mb. The color legend is given under each figure but the trait colors, automatically determined by the software, may change from one figure to the other. 1.1. Chromosome 1 1.2. Chromosome 2 1.3. Chromosome 3 1.4. Chromosome 4 1.5. Chromosome 5 1.6. Chromosome 6 1.7. Chromosome 7 1.8. Chromosome 8 1.9. Chromosome 9 1.10. Chromosome 10 1.11. Chromosome 11 1.12. Chromosome 12
Supplementary Figure 1.1: Position of the QTLs involved in the study for the 11 traits with more than 20 QTLs each. Distances on the map are in Mb. Chromosome 1 QTL are named according to the study in which they were detected followed by their ID number in TropgeneDB and a letter indicating under which conditions they were detected (w = well watered; s = water stress; c = compaction stress)
Supplementary Figure 1.2: Position of the QTLs involved in the study for the 11 traits with more than 20 QTLs each. Distances on the map are in Mb. Chromosome 2 QTL are named according to the study in which they were detected followed by their ID number in TropgeneDB and a letter indicating under which conditions they were detected (w = well watered; s = water stress; c = compaction stress)
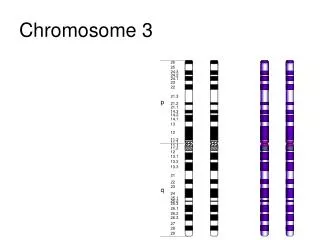
Supplementary Figure 1.3: Position of the QTLs involved in the study for the 11 traits with more than 20 QTLs each. Distances on the map are in Mb. Chromosome 3 QTL are named according to the study in which they were detected followed by their ID number in TropgeneDB and a letter indicating under which conditions they were detected (w = well watered; s = water stress; c = compaction stress)
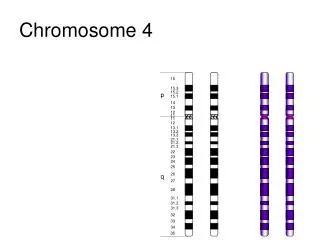
Supplementary Figure 1.4: Position of the QTLs involved in the study for the 11 traits with more than 20 QTLs each. Distances on the map are in Mb. Chromosome 4 QTL are named according to the study in which they were detected followed by their ID number in TropgeneDB and a letter indicating under which conditions they were detected (w = well watered; s = water stress; c = compaction stress)
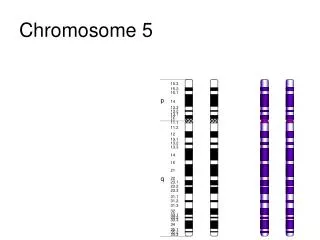
Supplementary Figure 1.5: Position of the QTLs involved in the study for the 11 traits with more than 20 QTLs each. Distances on the map are in Mb. Chromosome 5 QTL are named according to the study in which they were detected followed by their ID number in TropgeneDB and a letter indicating under which conditions they were detected (w = well watered; s = water stress; c = compaction stress)
Supplementary Figure 1.6: Position of the QTLs involved in the study for the 11 traits with more than 20 QTLs each. Distances on the map are in Mb. Chromosome 6 QTL are named according to the study in which they were detected followed by their ID number in TropgeneDB and a letter indicating under which conditions they were detected (w = well watered; s = water stress; c = compaction stress)
Chromosome 7 Supplementary Figure 1.7: Position of the QTLs involved in the study for the 11 traits with more than 20 QTLs each. Distances on the map are in Mb. Chromosome 7 QTL are named according to the study in which they were detected followed by their ID number in TropgeneDB and a letter indicating under which conditions they were detected (w = well watered; s = water stress; c = compaction stress)
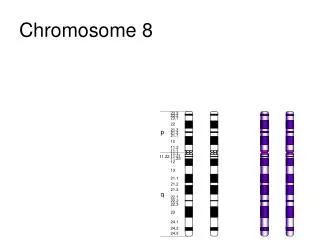
Supplementary Figure 1.8: Position of the QTLs involved in the study for the 11 traits with more than 20 QTLs each. Distances on the map are in Mb. Chromosome 8 QTL are named according to the study in which they were detected followed by their ID number in TropgeneDB and a letter indicating under which conditions they were detected (w = well watered; s = water stress; c = compaction stress)
Supplementary Figure 1.9: Position of the QTLs involved in the study for the 11 traits with more than 20 QTLs each. Distances on the map are in Mb. Chromosome 9 QTL are named according to the study in which they were detected followed by their ID number in TropgeneDB and a letter indicating under which conditions they were detected (w = well watered; s = water stress; c = compaction stress)
Chromosome 10 Supplemental Figure 1.10: Position of the QTLs involved in the study for the 11 traits with more than 20 QTLs each. Distances on the map are in Mb. Chromosome 10 QTL are named according to the study in which they were detected followed by their ID number in TropgeneDB and a letter indicating under which conditions they were detected (w = well watered; s = water stress; c = compaction stress)
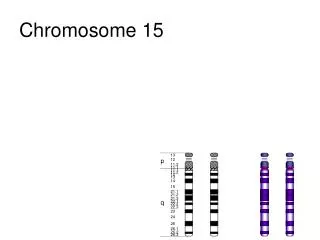
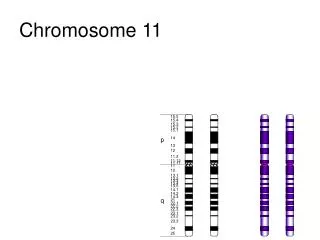
Supplementary Figure 1.11: Position of the QTLs involved in the study for the 11 traits with more than 20 QTLs each. Distances on the map are in Mb. Chromosome 11 QTL are named according to the study in which they were detected followed by their ID number in TropgeneDB and a letter indicating under which conditions they were detected (w = well watered; s = water stress; c = compaction stress)
Supplementary Figure 1.12: Position of the QTLs involved in the study for the 11 traits with more than 20 QTLs each. Distances on the map are in Mb. Chromosome 12 QTL are named according to the study in which they were detected followed by their ID number in TropgeneDB and a letter indicating under which conditions they were detected (w = well watered; s = water stress; c = compaction stress)