Download
1 / 26
260 likes | 398 Vues
This study explores wide-field surveys at millimeter wavelengths, focusing on chemical abundances and energy transfer within the interstellar medium (ISM). Using Mopra observations of molecules like CO, N2H+, and CH3OH, we investigate surprising spatial distributions and relationships to other tracers like HI and PDRs. The findings reveal complex dynamics, with turbulent energy transfer and significant molecular interactions. We propose that while the gas appears well-mixed on large scales, chemical differentiation occurs on smaller scales, influencing star formation processes.

E N D
Wide–field mapping with Mopra CO, CS or other molecules? Maria Cunningham, UNSW
Wide-field Surveys at mm wavelengths: putting the whole picture together • Follow chemical abundances through the whole ISM. • Follow energy transfer through the gas: turbulent cascade, triggered star formation. • Determine relationship to other phases/ tracers e.g. HI, PDRs
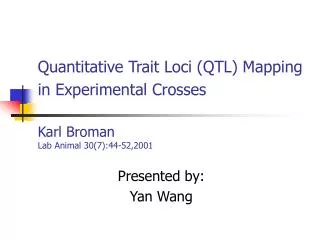
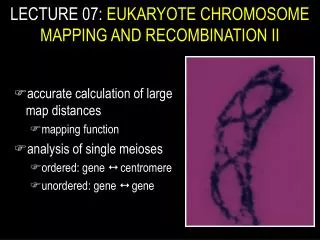
Following chemical abundances through a region: Surprising results. N2H+ (1-0) contours (yellow) on MSX 21.3mm greyscale. N2H+ should trace gas where CO is depleted, but here is is found in a shell around the MSX emission. Even more surprising is the fact that thermal methanol (97 GHz, blue contours) has a similar distribution to the N2H+. CH3OH is formed on grains surfaces, evaporating as gas warms, an environment that should destroy N2H+.
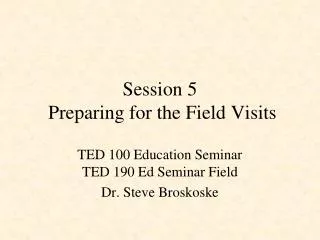
Image: AST/RO CO 4-3, greyscale, Mopra HNCO (green contour, left), Mopra N2H+(green contour, right). A similar situation is seen in the G1.6-0.025 molecular cloud. CO is almost certainly depleted towards the N2H+ 1-0 peak, but HNCO (a shock tracer), also peaks towards the N2H+. Higher resolution observations are needed to see what differentiation can be found at smaller spatial scales.
What have we learned from the the DQS (G333 survey)? • Energy Transfer through the gas follows a Kolmogorov-like power law from scales of ~ 20 pc to scales <~1 pc: • No significant energy injection between these scales, despite the obvious presence of dynamic structures: e.g. shells from HII regions, outflow. • Therefore the bulk of the turbulent energy is coming from colliding streams of HI/ CO (we don’t know as yet which it is; likely both). • Consistent with the results of Leao et al., 2008, arXiv0810.5374, who model star formation triggered by SNR expansion. Models and observations suggest this is common, but cannot provide the energy to drive SF rates we measure.
What have we learned from the the DQS (G333 survey)? • At these spatial scales (~1 to 20 pc) all molecules give similar power spectra, consistent with the gas being well mixed – turbulent mixing? PCA at large scales consistent with this. • However, principal component analysis shows that the gas is chemically well differentiated at small scales. • See Nadia Lo’s talk for more details
What have we learned from the the DQS (G333 survey)? • These two seemingly inconsistent facts – well mixed medium, but chemical differentiation apparent – make sense if we assume that: • While the gas is well mixed, the density follows a log-normal distribution in a magnetised, turbulent medium (e.g. Ostriker et al. 2001). • The bulk of the emission seen in each transition arises from a region of gas close to the critical density of that transition.
What have we learned from the the DQS (G333 survey)? • The turbulent cascade results in a clumpy medium, and is needed to explain the G333 CS excitation temperatures (clump: interclump ratio of ~0.2). • The clumps are unlikely to be discrete physical entities, and at each scale the clump-interclump medium is likely to have a contrast of about 0.1 to 0.2. • Therefore, density may be a major determinant of which transitions we see! • Density also has a strong effect on the chemistry –e.g. depletion of CO, shielding of N2H+. • However, we see strong differentiation near outflows, even within the Mopra beam (see forthcoming paper Bains et al.): Chemistry rather than density?.
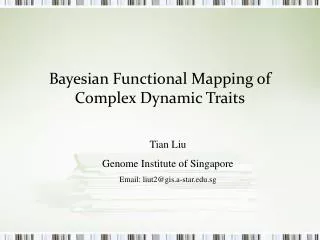
HI CO C2H CH3OH HCO+ HC3N Molecules shown close to critical density for 3-mm transitions: For illustration purposes only – don’t take the numbers too seriously!
Energy Transfer through the ISM: the need for a CO survey • Hennebelle et al., 2007, A&A, 465, 445 (and see talk, July 2007, ATNF talk archive) use MHD simulations to show that: • The HI is the ISM is two phase: Warm Neutral Medium, and Cool Neutral Medium • Phase change from WNM to CNM occurs where WNM flows converge. • Molecular clouds form from CNM. • The turbulent cascade may start in the CNM, with the molecular gas being basically a denser phase of the CNM.
Energy Transfer through the ISM • The properties of molecular clouds may largely be determined by the CNM out of which they have formed. • A CO survey, combined with SGPS data (McClure Griffiths et al. 2005), can test this scenario. • It will also determine if the HI is the main source of energy input, or if energy goes into the molecular phase at scales larger than 20 pc, due to super bubbles etc. Only CO can probe the molecular gas at scales larger than ~20 pc.
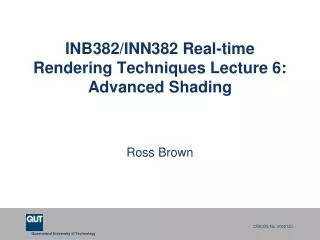
Black – Parkes HI SGPS, Green – Parkes +ATCA SGPS (McClure- Griffiths et al., 2005) Blue – CO, Bains et al. 2006
Other Considerations, other wavelengths • A CO southern Galactic plane survey will be useful for any ASKAP HI Galactic plane survey, for investigating the evolutionary cycle of interstellar matter (see e.g. Johnston et al. 2007). • However, it was the multi-molecular line nature of the DQS which showed that the turbulent cascade continues to small scales in the G333 region. • In other regions it may not, depending on the driving strength of the initial energy injection (from converging flows of HI or CO?), and from the properties of the local medium (magnetic fields, initial abundances?).
Other Considerations, other wavelengths • As well as the CO over a large area (order tens of degrees), multi-molecular line mapping is needed (order of ~20 pc) to determine the energy transfer through to smaller scales, for regions with different properties to G333. • For example, G331 has a particularly strong magnetic field, the Vela molecular ridge (~G265) has a mix of high and low mass star formation, colliding flows of gas may be present around G317.
Other Considerations, other wavelengths Surveys which span the two scales • large area CO, and • smaller area, more molecules – are needed to test the relationship between star formation outcomes and the large-scale properties of the ISM, relative to the effect of local factors.
How can 7 mm help? • The Mopra beam at this frequency is such that the resolution is ~ 1 pc at ~3.5 kpc. • The larger beam and typically better Tsys (Trx and Tatm) mean that the dense gas can be probed over larger spatial scales than at 3 mm, because of ~4x increase in mapping speed c.f 3 mm.
How can 7 mm help? • The CS 1-0 transition at 49 GHz traces gas with a critical density of ~2 x 104 cm-3. It is likely to be bright , widely distributed, and traces a critical density close to the denser tracers such as CS 2-1 and HCN 2-1. • Comparing the spatial power spectrum from CS1—0 to that of CO will show how much of the energy is being transferred from large to small scales in different regions. • Putting together information from HI (SGPS), CO (Mopra), and CS (Mopra) will give a large range of density scales over which to probe energy transfer and recycling within the ISM.
Some other considerations • Optical depth: The wide bandwidth of Mopra means that optically thin isotopologues will be observed simultaneously with both CO and CS, to correct the density calculation for this effect. • Other Molecules at 3-mm: Many CN transitions fall within the CO band (108 – 116 GHz). These transitions can be used to calculate magnetic fields (Falgarone et al. 2008, A&A, 487, 247). The sensitivity is unlikely to be good enough for this in the CO survey, but will point to regions for more sensitive observations.