Download
1 / 33
340 likes | 624 Vues
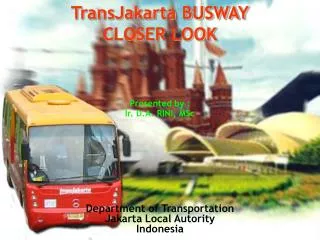
TransJakarta BUSWAY CLOSER LOOK. Presented by : Ir. D.A. RINI, MSc. Department of Transportation Jakarta Local Autority Indonesia. Existing Conditions. The area is about 750 km2 Number of vehicles aprox. 5,6 million. Average annual growth rate of vehicles increase 11% p.a.

E N D
TransJakarta BUSWAY CLOSER LOOK Presented by : Ir. D.A. RINI, MSc Department of Transportation Jakarta Local Autority Indonesia
Existing Conditions • The area is about 750 km2 • Number of vehicles aprox. 5,6 million. Average annual growth rate of vehicles increase 11% p.a. • The road infrastructure growth approx 1 %/p.a • Everyday, 138 new vehicles was operating. • Everyday600.000 carenter Bodetabek (commuter area ). • The total passenger trips are 17 million person-trips for each day, which 25% is a commuter trip from Bodetabek. Those trips comprise of 50,3% by public transportation and 49,7% using private cars. • Lack of Public Transportation. The total number of public transport decrease year by year
Daily Trip Jakarta and Bodetabek Year 2002 , 2010 , 2020 5.302.194 7.384.939 9.445.808 545.310 847.750 693.099 1.078.663 940.834 1.465.912 620.702 791.295 1.148.528
Number of Public Transport • Number of standard bus operated only 70 %
Infrastructure Conditions Comparison of Number of Vehicles & Infrastructure in DKI Jakarta 50 45 40 35 Width (Million m2) 30 25 20 15 2002 2004 2006 2008 2010 2012 2014 1994 1996 1998 2000 Road Time Series Vehic 3.300 3.000 2.700 2.400 2.100 1.800 1.500 1.200 Num of Vehicles (x 1.000)
Public Transportation Risk Sharing Analysis FUTURE PRESENT
Related Transportation Studies • 1974, JMATS, Jakarta Metropolitan Area Transportation Study • 1978, JICA, Study of Jakarta Ring-Road Project • 1981, JICA, Urban - Sub-Urban Railway Transportation in Jabotabek • 1981, Cipta Karya, Jakarta Metropolitan Development Planning • 1990, JICA, Integrated Transportation System Improvement by Railway and Feeder Service in Jabotabek Area • 1990, JICA, Jakarta Mass Rapid Transit System Study (JMTSS- BPPT-GTZ) • 1993, DitjenHubDar, Jabotabek Mass Rapid Network (TNPR) • 1996, JUTSI, Busway Feasibility Study • 1996, Recommendation on MRT Fatmawati – Kota (SAUM AJA) • 1999, DitjenHubDar, Revised Basic Design Study for MRT System • 2000, JICA, Study on Integrated Transportation Master-Plan I • 2002-2004, JICA Study on Integrated Transportation Master- Plan II;
TransJakarta Development Concept • Increasing number of trip • Provide reliable public transport; • Increasing safety • Integrated public transportation system; • Increasing performance of bus operators; • Provide more effective fare system
Bus Priority System (examp: busway) • Since January 15th 2004, busway operated on Blok M – Kota corridor (12,9 km) • Until 2010 will be develop 15 corridor until 2010 (totally 159 km)
PERFORMANCE OF BUSWAY OPERATION
OPERATION Utility & Efficiency Passenger Growth February – June 2004
Utility dan Efficiency… Daily Passanger : February – June 2004 General Election 5 Juli 2004 General Election 5 April 2004
Utility dan Efficiency… Comparations Between Passengers & Bus-km
JOURNEY SPEED Speed PerformanceBlok M-Kota) RUNNING SPEED
JOURNEY SPEED Speed Performance(Kota-Blok M) RUNNING SPEED
Management & Financial Revenue vs Total O&M Cost 15 January – June 2004
Management & Financial Passenger O&M Cost February – June 2004
Management & Financial O&M Cost ProportionFebruary – June 2004
User Opinion Frequency of Use of BuswayCorridor Blok M – Kota * * Source : JICA Team - SITRAMP
User Opinion... Previous Modes of TravelFor the Same Pattern of Trip * Sumber: JICA Team - SITRAMP
Opinion... Influential Factors in Selecting Busway * Sumber: JICA Team - SITRAMP
Opini... Perceptions of the Current Fare Level * Sumber: JICA Team - SITRAMP
Public Suggestion Public suggestion by telephone/Fax & e-mail(February – June 2004)
Public Suggestion News release about Busway – Mass Media(February – June 2004)