Download
1 / 22
220 likes | 347 Vues
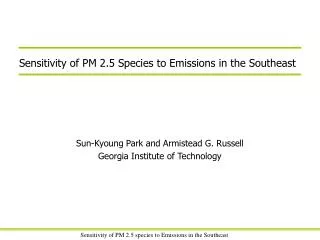
Sensitivity of PM 2.5 Species to Emissions in the Southeast. Sun-Kyoung Park and Armistead G. Russell Georgia Institute of Technology. Sensitivity of PM 2.5 species to Emissions in the Southeast. OVERVIEW. Comparison between CMAQ 4.2.2 and 4.3

E N D
Sensitivity of PM 2.5 Species to Emissions in the Southeast Sun-Kyoung Park and Armistead G. Russell Georgia Institute of Technology Sensitivity of PM 2.5 species to Emissions in the Southeast
OVERVIEW • Comparison between CMAQ 4.2.2 and 4.3 • Sensitivity of PM 2.5 to emissions in the Southeast for July 2001 and January 2002 using Models-3 (CMAQ 4.3/MM5/SMOKE) • Contents • Model Domain • Meteorological Input • Input of SMOKE and Modules in CMAQ • CMAQ 4.2.2 vs. 4.3 • Sensitivity of PM 2.5 to Emissions • Conclusion Sensitivity of PM 2.5 species to Emissions in the Southeast
1. Model Domain CMAQ horizontal domain and the vertical structure. Sensitivity of PM 2.5 species to Emissions in the Southeast
2. Meteorological Input MM5 version 3.5.3: Simple ice microphysicsKain-Fritsch cumulus scheme Rapid radiative transfer modelPleim Chang planetary boundary layerPleim-Xiu land surface model Four Dimensional Data Assimilation: NCEP Eta model outputs for the GCIP project NCEP ADP Observational data Evaluation: TDL surface hourly data Sensitivity of PM 2.5 species to Emissions in the Southeast
2. Meteorological Input RMSE Temperature (K) Specific Humidity (g/kg) Wind Speed (m/sec) July 2001 January 2002 Sensitivity of PM 2.5 species to Emissions in the Southeast
2. Meteorological Input Statistical benchmark (Emery et al., (2001)) Emery, C., E. Tai and G. Yarwood, 2001. “Enhanced meteorological modeling and performance evaluation for two Texas episodes”, report to the Texas National Reesources Conservation Commision, prepared by ENVIRON, International Corp, Novato, CA Sensitivity of PM 2.5 species to Emissions in the Southeast
3. Input of SMOKE and Modules in CMAQ • Input of SMOKE • Emissions inventory developed by GA Tech for the state of Georgia and 1999 National emissions inventory for other states • EGAS 4.0 growth factors and existing control strategy to project the 1999 emissions to 2001 and 2002 emissions • Modules in CMAQ • Chemical mechanism: SAPRC-99 • Chemistry solver: modified Euler backward iterative (MEBI) method • Cloud: the regional acid deposition model (RADM) • Aerosol dynamics: AERO3 • Deposition velocities of aerosols: AERO_DEPV2 • Horizontal and vertical advection: piecewise parabolic method (PPM) • Minimum vertical eddy coefficient: 0.3 m2/sec. Sensitivity of PM 2.5 species to Emissions in the Southeast
4. CMAQ 4.2.2 vs. 4.3 (daily PM 2.5) The performance of CMAQ was evaluated with measured data of SEARCH and ASACA stations JST Sensitivity of PM 2.5 species to Emissions in the Southeast
4. CMAQ 4.2.2 vs. 4.3 (daily PM 2.5, July 2001) OBS x 2 OBS x 0.5 Sulfate Nitrate Ammonium Elemental Carbon Organic Carbon PM 2.5 • 36 km (version 4.2.2)• 36 km (version 4.3) • 12 km (version 4.2.2)• 12 km (version 4.3) Sensitivity of PM 2.5 species to Emissions in the Southeast
4. CMAQ 4.2.2 vs. 4.3 (daily PM 2.5, January 2002) OBS x 2 OBS x 0.5 Sulfate Nitrate Ammonium Elemental Carbon Organic Carbon PM 2.5 • 36 km (version 4.2.2)• 36 km (version 4.3) • 12 km (version 4.2.2)• 12 km (version 4.3) Sensitivity of PM 2.5 species to Emissions in the Southeast
4. CMAQ 4.2.2 vs. 4.3 (hourly gas phase species, July 2001) OBS x 2 OBS x 0.5 O3 Statistics of O3 (12 km domain) CO NOy HNO3 PM 2.5 • 36 km (version 4.2.2)• 36 km (version 4.3) • 12 km (version 4.2.2)• 12 km (version 4.3) Sensitivity of PM 2.5 species to Emissions in the Southeast
4. CMAQ 4.2.2 vs. 4.3 (hourly gas phase species, July 2001) • Performance of CMAQ for PM 2.5 species • Sulfate: overestimated in July 2001 good in January 2002 • Nitrate: overestimated • Ammonium: good • Elemental Carbon: overestimated • Organic carbon: from version 4.2.2 to 4.3, the performance is improved markedly after the secondary organic aerosol algorithm has been modified to make the gas-particle partitioning of semi-volatiles reversible • PM 2.5: overestimated mainly due to the overestimation of the crustal elements (primary PM 2.5) Sensitivity of PM 2.5 species to Emissions in the Southeast
5. Sensitivity of PM 2.5 to Emissions • Sulfate: Major species of the PM 2.5 in the Southeast. Sources: anthropogenic emissions • Sensitivity of emissions to sulfate sensitivity of emissions to PM 2.5 • 20% reduction of SO2 • 20% reduction of NH3 • 20% reduction of NH3 and SO2 Sensitivity of PM 2.5 species to Emissions in the Southeast
5. Sensitivity of PM 2.5 to Emissions (20% reduction of SO2) Nitrate Sulfate July 2001 January 2002 : sensitivity, •: concentration Sensitivity of PM 2.5 species to Emissions in the Southeast
5. Sensitivity of PM 2.5 to Emissions (20% reduction of SO2) PM 2.5 Ammonium July 2001 January 2002 : D mass : sensitivity, •: concentration Sensitivity of PM 2.5 species to Emissions in the Southeast
5. Sensitivity of PM 2.5 to Emissions (20% reduction of NH3) Sulfate Nitrate July 2001 January 2002 : sensitivity, •: concentration Sensitivity of PM 2.5 species to Emissions in the Southeast
5. Sensitivity of PM 2.5 to Emissions (20% reduction of NH3) Ammonium PM 2.5 July 2001 January 2002 : D mass : sensitivity, •: concentration Sensitivity of PM 2.5 species to Emissions in the Southeast
5. Sensitivity of PM 2.5 to Emissions (20% reduction of NH3 and SO2) Sulfate Nitrate July 2001 January 2002 : sensitivity, •: concentration Sensitivity of PM 2.5 species to Emissions in the Southeast
5. Sensitivity of PM 2.5 to Emissions (20% reduction of NH3 and SO2) Ammonium PM 2.5 July 2001 January 2002 : D mass : sensitivity, •: concentration Sensitivity of PM 2.5 species to Emissions in the Southeast
5. Sensitivity of PM 2.5 to Emissions Sensitivity of PM 2.5 species to Emissions in the Southeast
5. Sensitivity of PM 2.5 to Emissions • The sensitivity of PM 2.5 to a 20% reduction of NH3: high in January 2002 SO2: high in July 2001 NH3 and SO2: high in both January 2002 and July 2001 Sensitivity of PM 2.5 species to Emissions in the Southeast
6. Summary • CMAQ 4.3 improved markedly in simulation of organic carbon concentration. However, model still overestimates primary PM 2.5 species. • When SO2is reduced, sulfate concentrations decreased, but nitrate concentrations increased. Thus, only SO2 reduction was not efficient way to reduce the PM 2.5 in winter time, when the nitrate concentrations are relatively high. • When NH3 is reduced, nitrate and ammonium decreased, but sulfate concentrations did not change much. Thus, NH3 reduction did not decrease PM 2.5 in summer time, when the sulfate concentrations are relatively high. • When NH3 and SO2 are both reduced, nitrate, sulfate and ammonium concentrations decreased significantly both summer and winter. • Future research will include the sensitivity of emissions for different geographic locations. Sensitivity of PM 2.5 species to Emissions in the Southeast