Download
1 / 68
690 likes | 868 Vues
Megapoli PM 2.5 /PM 10 emissions 24-30 June 2009. Anthropogenic (TNO). Megapoli PM 2.5 /PM 10 concentrations 24-30 June 2009. SURF Pro MINNI 2005: Uso degli algoritmi implementati nel modello per la stima delle emissioni naturali Camillo Silibello.

E N D
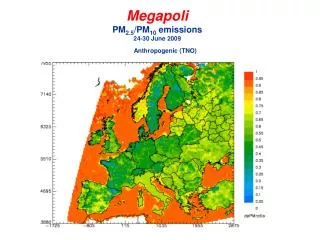
Megapoli PM2.5/PM10 emissions 24-30 June 2009 Anthropogenic (TNO)
Megapoli PM2.5/PM10 concentrations 24-30 June 2009
SURFPro MINNI 2005: Uso degli algoritmi implementati nel modello per la stima delle emissioni naturali Camillo Silibello ENEA, Riunione plenaria MINNI - Bologna, 4 marzo 2010
Vautard et al., 2005Bulk resuspension scheme where F is tht dry soil resuspension flux [g m-2 h-1], f(w) is a function of the soil water: f(w)=0 when w > 0.2 kg kg-1; f(w)=1 when w < 0.1 kg kg-1; between these values a linear interpolation is performed to compute f(w). 2/3 of emissions are attributed to the fine mode (< 2.5 m) and 1/3 to the coarse mode (2.5-10 m)
Vautard et al., 2005Bulk erosion scheme“…our goal is not to develop a sophisticated erosion scheme for temperate regions …” where is the sandblasting mass efficiency (=5x10⁻⁵), fb is the fraction of bare ground where dust is available for entrainment and fc is the crustation factor. The product fb fc is taken constant over land and is tuned to optimize the model/observation correlations (=4x10⁻³). k is the von Karman constant (=0.4), z0 is the saltation roughness length (=5x10⁻⁴ m), w*the convective velocity scale (m s-1), fw is the soil moisture factor and u*,0 is the minimal u* for dust entrainment over soil (=0.1 m s-1). When w > 0.2 kg kg-1 dust emissions are set to zero and kept as the scheme calculates when w < 0.16 kg kg-1; between these values a linear interpolation is performed. 50% of emissions are attributed to 10-40 m mode, 45% to 2.5-10 m mode and 5% to fine mode.
REFERENCES MaB95 B. Marticorena and G. Bergametti, Modeling the atmospheric dust cycle: 1-Design of a soil derived dust production scheme, J. Geophys. Res., 100, 16415-16430, 1995 MaB97a B. Marticorena, G. Bergametti, B. Aumont, Y. Callot, C. N'Doumé and M. Legrand, Modeling the atmospheric dust cycle: 2-Simulations of Saharan dust sources, J. Geophys. Res., 102, 4387-4404, 1997 MaB97b B. Marticorena, G. Bergametti, D. A. Gillette and J. Belnap, Factors controlling threshold friction velocity in semiarid and arid areas of the United States, J. Geophys.Res., 102, 23277-23287, 1997 FMB99 F. Fécan, B. Marticorena and G. Bergametti Parameterization of the increase of the aeolian erosion threshold wind friction due to soil moisture for semi-arid areas, Annales Geophysicae, 17, 149-157, 1999. Vau05 R. Vautard, B. Bessagnet, M. Chin, L. Menut On the contribution of natural Aeolian sources to particulate matter concentrations in Europe: Testing hypotheses with a modelling approach, Atmospheric Environment, 39, 3291-3303 (2005). NKP01 S. Nickovic, G. Kallos, A. Papadopoulos, O. Kakaliagou A model for prediction of desert dust cycle in the atmosphere. J. Geophys. Res., 106, D16, 18113-18129, 2001 ZBN03 Zender, C. S., H. Bian, and D. Newman, Mineral Dust Entrainment And Deposition (DEAD) model: Description and 1990s dust climatology, J. Geophys. Res., 108(D14), 4416 ChF08 Yu-Jin Choi and H.J.S. Fernando Implementation of a windblown dust parameterization into MODELS-3/CMAQ: Application to episodic PM events in the US/Mexico border, Atmospheric Environment, 42, 6039-6046 (2008). ShL00 Yaping Shao and Hua Lu A simple expression for wind erosion threshold frictionvelocity. J. Geophys. Res., 105, D17, PAGES 22,437-22,443, SEPTEMBER 16, 2000
Particle motion CREEP Too large or too heavy to be lifted from the surface, roll and creep along the surface Dp >2000 m SALTATION Able to be lifted from the surface at a height of some tenth of cm. Since the drag is not sufficient to exceed the weight they are carried downwind back to the surface 60 < Dp < 2000 m SUSPENSION Small enough to be transported upward by turbulent eddies Dp < 60 m
Particle motionSANDBLASTING The movement of fine particles is not initiated directly by the wind friction on the erodible surface (strong cohesion forces linking them to each other) and requires sandblasting or bombardment processes to disrupt the aggregates and produce dust particles that will be set in suspension. Lift by wind shear Lift by saltation of large particles suspension blasting
Horizontal flux (saltation) The friction velocity u* is the fundamental quantity determining dust emissions. The horizontal flux (saltation) is given by the following functional form (g, cm, s units): where Csis a constant equal to 2.61, a is the air density(0.001227 g cm-3), u*,sthe saltation friction velocity (cm s-1), g the gravity acceleration (980 cm s-2) and a functional form whose role is to suppress emissions when saltation friction velocity is below its threshold value:
0.03 < Re*t10 Re*t>10 Threshold friction velocity u*t Following Marticorena et al. (1995) u*tis given by the following expression (g, cm, s units): with: where p and Dp are respectively the particle density (2.65 g cm-3) and diameter. Re*tis the friction Reynold number where is the kinematic viscosity of air. 0.006 is g cm0.5 s-2, all other are dimensionless. In the approximate expression a=1331, b=0.38 and x =1.56.
Threshold friction velocity u*t Following Shao and Lu (2000) u*tis given by the following expression (g, cm, s units): where AN =0.0123 and =0.3 g s-2.
strong cohesion forces linking fine particles each other Minimum at about D0=75 m Threshold friction velocity u*t The optimal particle size for saltation D0 occurs where u*tis at minimum.Following Marticorena et al.(1995) all soils in erodible regions contains particles of size D0, so that saltation is initiated whenever u*> u*t(D0)
u*t dependency on roughness length Saltating grains, alternating contact with the the surface and the air, remove momentum from the air and thus produce a sort of resistance to the wind. The presence in soils of nonerodible elements affects the erosion threshold by two ways: 1) roughness elements cover part of the surface and thus protect it from aeolian erosion; 2) consume part of the momentum that will not be available to initiate particle motion. This process is expressed as an increase fd in the threshold friction velocity to saltation: where 0.1 m. Zender at al. have proposed following values for z0,m (roughness length for momentum transfer) andzs0,m (“smooth” roughness length) 100 m and 33.3 m (10 m Marticorena et al.)
w < w’ w > w’ u*t dependency on soil moisture Wind erosion threshold increase with increasing soil moisture, due to interparticle forces. This process is expressed as an increase fw in the threshold friction velocity due to soil moisture: Fecan et al. (1999) proposed the calculation of w’ as a function of clay content in soil:
Owen effect Saltation increases friction speed by roughening surface ("Owen's effect“). Increase in friction velocity due to saltation varies as square of difference between reference wind speed and reference threshold speed:
Land use constraint Significant dust plumes emanate from completely barren regions (e.g. deserts) However there are significant sources of dust in semi-arid regions where vegetation may act as a primary dust constraint. The fraction of bare soil suitable for mobilization Am is the maximally overlapped product of the fractions of dry ground, ground not covered with snow, nonurban and nonvegetated ground (Zender et al., 2003):
Soil Texture(FAO Soil data) Clay fraction Two ASCII files which contains the depth and particle size information (SOILDATA.NEW) and the 1x1 degree ocean/continental coding and Zoblers World soil file data (CONTZOB.LER). Webb, Robert S., Rosenzweig, Cynthia E., and Levine, Elissa, R. "A Global Data Set of Soil Particle Size Properties". NASA Technical Memorandum 4286
Soil Texture Nickovic et al. (2001) have classified particle emanating from desert soils into four classes, based on the contents of clay, silt (50% small and 50% large silt) and sand. is the ratio between the mass available for uplift and the total mass
Sandblasting mass efficiency The horizontal (saltation) mass flux Qh is converted to a vertical dust mass flux F with an efficiency called sandblasting mass efficiency =F/Qh. Observations reveal that F exhibits high sensitivity to parent soil texture. Chemical analysis of desert aerosol samples indicates that these dust particles are mainly composed of aluminosilicated components indicating that the soil fraction able to deliver fine particles id the clay fraction. Following expression is used to estimates :
Vertical flux The vertical dust mass flux F [g m-2 s-1] is given by the following expression Zender et al., 2003: where E is the erodibility factor (0.13 Liu and Westphal, 2001), soil is the ratio between the mass available for uplift and the total mass for each soil type, T is a tuning factor (a posteriori =7x10⁻⁴, Zender et al., 2003) and is the sandblasting mass efficiency. According to Zender et al. (2003) the erodibility is set to zero along coasts and north of 60°N.
Soil Atlas Soil compositionSANDFAO vs Soil Atlas FAO
REFERENCES Alduchov and Eskridge (1996) Improved Magnus Form Approximations of Saturation Vapor Pressure, Journal of Applied Meteorology, 35, 601-609. Binkowski F.S. and S.J. Roselle (2003) Models-3 Community Multiscale Air Quality (CMAQ) model aerosol component 1: Model Description, J. Geophys. Res., 108, D6, 4183. Seinfeld, J.H. and S.N. Pandis (1998) Atmospheric Chemistry and Physics - from air pollution to climate change, John Wiley & Sons, Inc.. Zhang, K.M., E.M. Knipping, A.S. Wexler, P.V. Bhave, G.S. Tonnesen (2005) Size distribution of sea-salt emissions as a function of relative humidity, Atmospheric Environment, 39, 3373-3379.
Theory According to ANPA (2001) VOC emissions [g m-2 h-1] from vegetation are given by: where is the emission potential potential [g g h-1] associated with land use categories,D the foliar density [g m-2] and is a complex factor depending on temperature and solar radiation. Isoprene emissions occur between April and October and during daylight, while monoterpenes emissions have no time dependency. ANPA (2001) Linee Guida agli Inventari Locali di emissioni in Atmosfera, RTI CTN_ACE 3/2001
Theory According to Williams et al. (1992) NO emissions [ngN m-2 s-1] from soils are given by: where the seasonal modulation and , Tsoil, a and b respectively the emission factor [ngN m-2 s-1], soil temperature [°C], and soil temperature parameters associated with land use categories. E.J.Williams, A. Guenther, F.C. Fehsenfeld (1992) An Inventory of Nitric Oxide Emissions from soils in the United States, J. Geophys. Res., 97, D7, 7511-7519.