Download
1 / 37
380 likes | 402 Vues
Explore cutting-edge research facilities like laboratory spaces, plant growth cabinets, image analysis systems, and more for in-depth horticulture studies at our premier institute. Discover advanced equipment at the forefront of the industry.

E N D
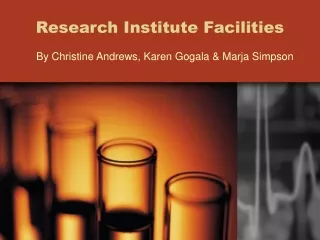
Research Institute Facilities By Christine Andrews, Karen Gogala & Marja Simpson
Horticulture Centre Equipment • Laboratory facilities with large working space • Trial Site Area • Plant Growth Cabinets • Large Capacity Dehydrating Oven • Cool Room • Video and scanner based image analysis system • Glasshouses with automatic heating and cooling • Steam generator • Automatic weather stations
Plant Growth Cabinets • 1 large cabinet, 2 smaller cabinets • Temperature and humidity controlled • Lighting intensity variable by switching lamps • 24 h timers provide control between instruments
Dehydrating Oven & Cool Room Operating range is +10oC to + 200oC
Video and scanner based image analysis system • Captures images with coloured video camera, Delta-T SCAN splash-protected flatbed scanner • WinDIAS and Delta-T SCAN image analysis software analyse images • Usage:WinDIAS- Measurement of the area of healthy and diseased plant leaves • Delta-T SCAN- Leaf measurement, Root length measurement, object size analysis, eg. soil particles, seeds, measurements from photographs or copies, count objects, eg. seeds
Glasshouses • Glasshouse size 3m x 7.5m x 3m • Automatic cooling and heating system • Winter heating capacity 10oC overnight, 20oC day • Summer cooling 20-25oC • Lighting is provided by incandescent and fluorescent lamps which is 24 h timer controlled
Steam Generator • Soil and plastic container treatment to control soil borne fungal diseases, nematodes and weeds
Automatic Weather Station • 2 stations • Records: Wind speed, wind direction, air temperature, rainfall, relative humidity, solar radiation, logger calculates evaporation • Data available online http://www.orange.usyd.edu.au/research/weather/index.htm
Soil Shaker • The Endecotts EFL 2000 is a vibrating shaker that is used to carry out sieve tests in conjunction with sieve stacks for particle sizing of various material samples. • Sizes of sieves available: 1.0mm 2.0mm 500micron 250micron 125micron 63micron
Equipment – Research Lab • Atomic Absorption Spectrometer • UV/Visible Spectrometer • Scanning Electron Microscope • Fluorescence Microscope • PCR System • Automontage Microscope • GIS System • GC/MS • HPLC
Atomic Absorption Spectrometer (AAS) • Measures the amount of light absorbed by atoms • Liquid sample aspirated, aerosolized & mixed with gas • Ignited in flame • Atoms reduced to free state which absorbs light
UV/VIS Spectrophotometer • Measures amount of light a sample absorbs • A beam of light passes through onto a detector • Amount of molecules in a sample can be detected • Both UV & visible spectra
Scanning Electron Microscopy • Creates magnified images by using electrons instead of light waves • Shows 3D images at much higher magnification • Samples prepared – sputter coater
Fluorescence Microscopy • Sample you want to study is the light source • Energy absorbed by atom; it gets excited • Electron jumps to a higher energy level • Drops back to ground state, emits a photon (fluorescing)
PCR Room • Polymerase Chain Reaction is a molecular biological technique for amplifying DNA without using a living organism. • PCR is commonly used in medical and biological research labs for a variety of tasks.
Automontage Microscopy • Perfectly focused 3D images • Increased depth of field software • Allows images of small insects almost as good as the specimen itself
GIS System • Manages spatial data and associated attributes. • It is a computer system capable of integrating, storing, editing, analysing, and displaying geographically-referenced information.
HPLC and GC/MS • High Performance Liquid Chromatograph • Gas Chromatograph coupled with a Mass Spectrometer
High Performance Liquid Chromatograph • Chromatography—what is it? • Liquid Chromatography • Basic Operation • Equipment used • Types of Chromatography • Applications for HPLC
What is chromatography? • Chromatography –’colour’ and ‘to write” • Originally described by Tswett in 1906 who devised a method to separate plant pigments using a tube filled with CaCO3. • Basically it is a broad range of physical methods used to separate and /or to analyse complex mixtures • Components to be separated are distributed between two phases:a stationary phase bed and a mobile phase which flows through the stationary bed. • Individual species are retained by the stationary phase (packing) based on various interactions such as surface adsorption, relative solubility of the sample in the mobile phase and charge.
Chromatography • LC-mobile phase is a solvent and stationary phase is a packed bed of silica particles.
Liquid Chromatography • HPLC is this process conducted at a high velocity and under pressure. • Sample can be in an aqueous form or in an organic/aqueous form. • Sample is injected onto the column and is pushed through by the mobile phase(eluent) under high pressure. • Components are retained and separated on the column.They elute at different times depending on their chemical interaction with the packing in the column. • The time at which they elute (retention time) is a characteristic of that compound. • After compounds elute,they enter a detector(PDA) which creates an electronic signal. The greater the concentration of the compound, the greater the signal.
Liquid Chromatography • Chromatogram
Equipment used • Shimadzu HPLC
Adsorption Types of chromatography • Ion Exchange
Applications • Chemical separations • Identification • Quantification • Purification • Cosmetics,energy,food,life sciences pharmaceutical, biomedical, drug detection and identification. Carbohydrates in vegetables Herbicides
Gas Chromatograph/Mass Spectroscopy (GC/MS) • Gas Chromatograph • Mass Spectrometer
Gas Chromatograph • Mobile phase is an inert gas such as helium • Sample is injected into a heated injection port, becomes vapourised and travels onto the column by means of the carrier gas. • Column is made of fused silica onto which is coated the liquid stationary phase and it is enclosed in a heated zone(oven) • Compounds become separated as they interact with the column • Variables are temperature,gas flow, and column specifications. • Separated compounds identified by specific detector.(FID.NPD,ECD)
Gas Chromatography • Schematic diagram
Mass Spectrometer • Creates charged particles (ions) from molecules. • Analyzes those ions to provide information about the MW of the compound and it’s chemical structure • Many types of MS which allow wide range of analyses. • GC/MS is the coupling of GC with MS
GC/MS • A. Capillary column interface which connects GC to mass spectrometer • B. Sample enters ionization chamber • Ionization occurs. A beam of electrons impacts the sample molecules which lose an electron becoming positive (M+) • C. A positive potential is applied to repel the + ions out of the ionization chamber and into the mass analyser.(filter)
GC/MS • Mass analyser separates the positively charged particles under vacuum according to their mass. • Particles then enter a detector which sends information to the computer and resulting chromatograms give a mass spectrum of the sample components. • Identification of the compound relies on the fact that every compound has a unique fragmentation pattern.
GC/MS • Mass Spectrum Jamaican coffee