3.4 Cause and Effect
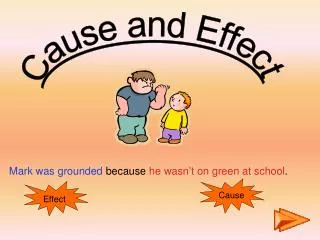
3.4 Cause and Effect. Usually the main reason for a correlational study is to find evidence of a cause-and-effect relationship Cause and Effect Relationship: when a change in the independent variable, x, produces a change in the dependent variable, y. 3.4 Cause and Effect.

3.4 Cause and Effect
E N D
Presentation Transcript
3.4 Cause and Effect Usually the main reason for a correlational study is to find evidence of a cause-and-effect relationship Cause and Effect Relationship: when a change in the independent variable, x, produces a change in the dependent variable, y.
3.4 Cause and Effect • Examples of cause and effect relationships: • Physical activity will cause your heart rate to increase • Increasing the temperature on the thermostat will cause the room temperature to increase • More hours studied will cause your marks to increase
3.4 Cause and Effect Relationships Common Cause Factor • An external variable that causes two variables to change in the same way • Crimes and churches example: POPULATION is the common cause variable Crimes Churches
3.4 Cause and Effect Relationships Reverse Cause and Effect Relationship • The dependent and independent variable are reversed in the process of establishing causality • For instance, suppose that statistics show a positive correlation between gun ownership and violent crime, namely, the higher number of guns owned, the higher the rate of violent crime. It would be tempting to jump to the conclusion that gun ownership causes violent crime, but the causal relationship may be the exact reverse. High rates of violent crime may cause fearful citizens to purchase guns for protection
3.4 Cause and Effect Relationships Accidental Relationship • A correlation exists without any casual relationship between the variables • For example, there has been an increase in the number of reality shows on TV over the last five years. Over the same time period, there has been an increase in the number of females enrolled in engineering programs • These two variable have a positive correlation, however, they are purely coincidental
3.4 Cause and Effect Relationships Presumed Relationship • A correlation does not seem to be accidental even though no cause and effect relationship exists • Suppose you found a correlation between people’s fitness levels and the amout of action movies that they watch. Seems logical to make a conclusion that a physically fit individual may prefer adventure movies, however, it would be very difficult to prove that one variable affects the other
3.4 Cause and Effect Relationships Extraneous Variable • An external variable that complicates the nature of the cause and effect relationship between two variables • Seems logical that study • time will affect test scores, • however, there are many • extraneous variables that • complicate the cause and • effect relationship. • Sleep hours before test • Attendance in class • Other courses • Part time job hours • Ability to take tests • Etc..
3.4 Cause and Effect Relationships Extraneous Variable • In order to reduce the effect of extraneous variables, researchers often compare an experimental group to a control group. • The two groups are as similar as possible so that any extraneous variable will have about the same effect on either group • Researchers will vary the independent variable for the experimental group but not the control group • Any difference in the dependent variable for the two groups can then be attributed to the changes in the independent variable and not the extraneous variables