Download
1 / 39
440 likes | 1.37k Vues
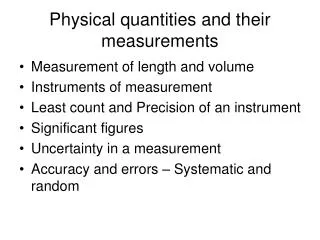
Physics and Physical Measurements. Nature provides different experiences to the mankind. These experiences are scientifically termed as Physical quantities we have two types of physical quantities. Fundamental quantities Derived quantities. These are independent Eg: Mass, Length, Time ,….

E N D
Nature provides different experiences to the mankind. • These experiences are scientifically termed as Physical quantities • we have two types of physical quantities. • Fundamental quantities • Derived quantities
These are independent Eg: Mass, Length, Time ,…. They have fundamental units like kg massm LengthS Time These are dependent on Fundamental Eg: area, volume, density, force,…. They have derived units likem2 aream3 Volumekg/m3 Density Fundamental Derived
Order of magnitude • This is power of 10 • It is helpful to avoid getting lost among the numbers • Eg. The diameter of an atom, 10-10m does not sound much larger than diameter of proton in its nucleus, 10-15m. • But the ratio between them is 105 or 100000 times bigger. This is we say a difference of 5 orders of magnitude’ Site add: http://www.youtube.com/watch?v=ZldMduYXeeU to see macro to micro Site add: http://www.youtube.com/watch?v=lRq6e4mXb8w to see quarks to outer space
Range of masses 1024 1028 1040 1044 1052 Kg 10-31 10-8 Mass of the Observed universe Mass of Milky way galaxy electron Mass of the earth Grain of sand/ Blood corpuscle Most fundamental particle is quark and it hides inside proton and neutron. the lightest quark is up quark , whose mass is about 10-30 kg.
Range of lengths 106 108 1010 1012 1026 m 10-15 10-10 Radius of Observed universe Distance of Earth to sun Diameter of proton Radius of the earth Diameter of atom There is a much smaller fundamental unit of length, Planck length, which is around 10-35 m.
Range of Time 100 s 10-24 10-22 10-20 10-18 10-8 1016 1018 1018 1020 Heart beat Age of the earth Age of the universe Passage of Light across A nucleus Passage of Light across A room Passage of Light across An atom What is theoretical lower limit of time? Estimation – what is ratio of rest mass of proton to rest mass of electron?
Significant figures • These are number of digits up to which we are sure about their accuracy. • Significant figures do not change if we measure a physical quantity in different units. • E.g. 14.5 cm = 0.145 m = 14.5 X 10⁻²m Here three values have same significant figures i.e. 3
Rules for significant figures • All non zero digits are significant figures. • 17 - 2 • 178 - 3 • All zeros occurring between non zero digits are significant figures. • 401 - 3 • 40056 - 5 • All zeros to the right of the last non zero digit are not significant figures. • 20 - 1 • 20350 - 4
All zeros to the right of a decimal point and to the left of a non zero digit are not significant figures. • 0.04 - 1 • 0.0045 - 2 • All zeros to the right of a decimal point and to the right of a non zero digit are significant figures. • 0.20 - 2 • 0.2370 - 4
Exercise on significant figures • State the number of significant figures in the following: • 0.005 m2 • 2.63 X 1028 kg • 0.2560 g. cm-3 • 6.320 N • 0.0006032 • 200.05
Derived units For other derived quantities refer course companion
Conversion between units • CGS system VS SI system • 1m = 100 cm, 1kg = 1000 g, 1min = 60 s, 1h = 60 min = 3600 s • 1kmph = _______ m.s-1 • Kg.m.s-2 = __________ g .cm .s-2 • Kg.m2.s-2 = __________ g.cm2.s-2 • 1 kwh = ___________ J • 1 eV = _____________ J
Exercise on prefixes • Change 236000 J to MJ • Radio frequency is 12300000 Hz. Change in GHz • Wavelength of white light is 5.0 x 10⁻⁷m. Express in nanometre. • Time of an event is 1 x 10⁻⁶s. Express in prefix format. • Change 1 M W to K W • Change 1nm into 1pm
Significant figures in algebric operations • Addition and subtraction operation • When we add two like quantities, then the final result cannot be more accurate than the least precise quantity. • E.g. sum of 2.3 m and 10.54 m = 12.84 m, but 2.3 m is the least precise. i.e. it is accurate up to 0.1 m . Hence the final result will be 12.8 m. • Multiplication and division operation • When we multiply two quantities, then the final result cannot be more accurate than the least precise quantity. • e.g. product of 4.192 and 2.02 = 8.46784, but 2.02 is the least precise. Hence the final result will be 8.47
Accuracy & Precision • Accuracy tells how close the measured value is to the true value of the quantity. • Precision tells us to what resolution or limit the quantity is measured. • E.g. suppose the true value of a certain length is 4.859 cm. in one exp, using instrument of precision 0.1 cm, the measured value found to be 4.7 cm, while in another exp using instrument of precision 0.01 cm, the length found to be 4.56 cm. • Here first measurement has more accurate but less precision. • Second measurement has more precision but less accurate.
Bull’s eye game Precise, not accurate Accurate, not precise Neither precise nor accurate Both accurate and precise
Uncertainty or error in measurement • The difference in the true value and measured value is called error. • Types of error • Random error • Systematic error Random error • usually random errors are caused by the person doing the experiment. • Causes – • changes in the experimental conditions like temp, pressure or humidity etc.. • A different person reading the instrument • Malfunction of a piece of apparatus
Systematic error • This error is due to the system or apparatus being used. • Causes– • An observer consistently making the same mistake • An instrument with zero error • Apparatus calibrated incorrectly • How to avoid the errors? • Random errors can be reduced by repeating the measurement many times and taking the average, but this process will not effect systematic errors. • An accurate experiment is one that has a small systematic error, where as a precise experiment is one that has a small random error.
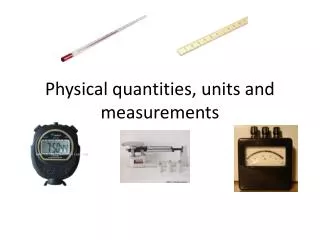
Measuring tools • Metre scale • Vernier calipers • Screw gauge • Beam balance • Common balance • Spring balance • Stop watch
Mathematical representation of uncertainties • Absolute error (Absolute uncertainty) – It is the magnitude of difference between true value of quantity and the measurement value.If p is the measured quantity then absolute error expressed as ±∆p • Relative error (Fractional uncertainty)– The ratio of absolute error to the true value of the physical quantity is called relative error.Here ±∆p is the relative error. P • Percentage error (Percentage Uncertainty) – relative error X 100% = ±∆p X 100% P
Example: • mass of a body is (20 ± 0.2) Kg. Here • absolute uncertainty = ± 0.2 kgrelative uncertainty = 0.2 = ± 0.01 20 • Percentage uncertainty = 0.01 X 100% = 1% So mass of a body = 20Kg ± 0.01 or 20 kg ± 1%
Uncertainty in Addition and SubtractionA, B are two quantities and Z = A + B or Z = A - B∆A, ∆B, ∆Z are uncertainties in A, B, Z respectivelythen ∆Z = ∆A + ∆B • Uncertainty in Multiplication and DivisionA, B are two quantities and Z = A X B or Z = A / B∆A, ∆B, ∆Z are uncertainties in A, B, Z respectivelythen ∆Z = ∆A + ∆B Z A B • Uncertainty in powersA is quantity and Z = An then∆Z = n ∆A Z A
Numericals • Two bodies have masses (20 ± 0.2) Kg and (30 ± 0.4) Kg. what is the total mass of these bodies? • Area of a rectangle field is A = l X b , l = (200 ± 5) m and b = (50 ± 2) m. find the percentage error in A? • Density of a substance is d = m/v , m = (20 ± 0.2) Kg and v= (10 ± 0.1) m3. Calculate the percentage error of d? • A physical quantity Z is given by Z = a2b3. Calculate the relative c4and percentage error in Z. • the percentage errors in the measurement of mass and speed are 2%, 3% respectively. How much will be the max error in the estimate of the KE?
Graphs introduction • The graph should have a title. • The scales of the axes should be suitable – there should not be any sudden or uneven jumps in the numbers. • The inclusion of the origin has been thought about. You can always draw a second graph without it if necessary. • The final graph should cover more than half the paper in either direction. • The axes are labelled with both the quantity and units • The points are clear. Vertical and horizontal lines to make crosses are better than 45 degrees crosses or dots.
All the points have been plotted correctly. • Error bars are included if necessary. • A best fit line is added. It is there to show overall trend. • If best fit line is a curve, this has been drawn as a single smooth line. • As a general rule, there should be roughly the same number of points above the line as below the line. • Any points that do not agree with the best fit line have been identified.
Gradient and intercept • Intercept • A straight line graph can only intercept (cut) either axis once and often it is y – intercept. • if a graph has an intercept of zero it goes through the origin. (proportional) y intercept
Gradient or slope • It is the ratio of change in y – axis to the change in x – axis. • i.e. m =∆y • ∆x • A straight line graph has a constant gradient. • The triangle used to calculate the gradient should be as large as possible. • The gradient has units. • The gradient of a curve at any particular point is gradient of the tangent to the curve at that point. ∆y ∆y ∆x ∆x
Area under a graph • it is the product of quantity on y axis and by the quantity on x axis. • i.e. Area = quantity on y X quantity on x • If the graph is a curve, the area can be calculated by counting the squares and working out what one square represents. • The units for the area under graph are the units on the y axis multiplied by the units on the x axis.
Exercise • what is the slope of distance – time graph? • What is the slope, area of speed – time graph? • What is the area of acceleration – time graph? • If v = at + u represents y = mx + c then find m, y intercept and show them in a rough graph?
Exercise on graphs • The following data is about to find acceleration due to gravity using simple pendulum. • draw a graph between l (y – axis), t2 (x – axis) show that it is a st line. • Find the slope of the graph and find the g using the formula g = 4π2.l/t2
The following data is about to show that n2 (v+e) = const, where n = frequency of tuning fork, v = volume of the air in the volume resonating column, e = end correction in volume resonance exp • Draw a graph between 1/n2 (X – axis), v (Y – axis) and show that it is a st line. • Find slope and y intercept and label it as e. • Compare the above eq with y = mx +c and write the slope and y intercept.
Uncertainties in graphs • Uncertainties in graphs can be shown as error bars • Uncertainties are many types. • With analog instruments, such as rulers, you would add onto the end of a value a plus or minus half the value of the last digit, eg. on a ruler with 1mm precision, you would put +/- .5mm. • Digital instruments use a different system, where it is plus or minus the value of the last digit, eg. with an electronic scale that reads 291g, the uncertainty would be +/- 1g. • We take a time of 8.06 s with a stopwatch that measures 1/100 seconds, so half the limit of reading would be 0.005 s. But we know from experience that our reaction time is longer than that, so we estimate it to for example 0.10 s, and have the result 8.060.1s.
If we have several (at least about 5) measurements of the same thing, we can use the highest residual as an absolute uncertainty. A residual = the absolute value of the difference between a reading and the average of the readings. • Ex. Five people measure the mass of an object. The results are 0.56 g, 0.58 g, 0.58 g, 0.55 g, 0.59g. The average is (0.56g + 0.58g + 0.58g + 0.55g + 0.59g)/5 = 0.572g • The residuals are 0.56g - 0.572g = (-) 0.012g, 0.58g - 0.572g = 0.008g, 0.58g - 0.572g = 0.008g, 0.55g - 0.572 g = (-)0.022 g, 0.59g - 0.572g = 0.018g • Then the measurement is m = 0.572g0.022g or sometimes 0.570.02g (uncertainties are usually approximated to one significant digit).
To change curve in to linear line Click on the measurements • To know how to draw max , min gradients click on maxmin gradient • Make the students to draw graph with error bars manually and electronically (Excel)
Vectors • Vector – which having magnitude and direction e.g. displacement, velocity, acceleration, force, momentum, impulse, torque,….etc • Scalar – which having only magnitudee.g. distance, speed, time, mass, temp, current, charge, potential,…etc. • Vector Representation p o A Magnitude = |p| Direction = towards east Vector = OA or p
Concepts to be discussed • Vector addition • Polygon law • Vector subtraction • Exercise • Vector resolution – importance • Examples on resolution • Force and displacement • Inclined plane • Rain fall • Exercise from text book/ reference book