Download
1 / 19
190 likes | 294 Vues
This review covers key concepts in descriptive statistics, focusing on variability (range, variance, standard deviation, and coefficient of variation) and their applications to two data sets. We delve into the significance of standard scores and explore the relationships between dependent and independent variables through correlation analysis, using real-life examples. The review highlights the distinction between correlation and causation, the importance of coefficient of determination (r²), and discusses common misuses of correlation. Gain insights into statistical validity, reliability, and prediction errors in data analysis.

E N D
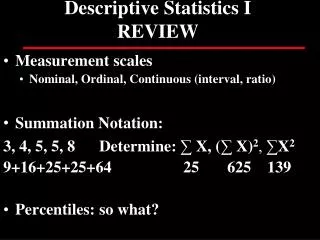
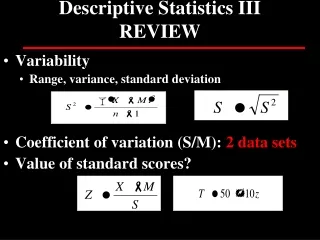
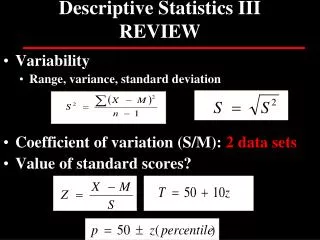
Descriptive Statistics IIIREVIEW • Variability • Range, variance, standard deviation • Coefficient of variation (S/M): 2 data sets • Value of standard scores?
Correlation and Prediction HPHE 3150 Dr. Ayers
Variables Dependent • (ordinal/continuous: #) • Presumed effect • Consequence • Measured by researcher • Predicted • Criterion • Y Independent (categorical: name) • Presumed cause • Antecedent • Manipulated by researcher • Predicted from • Predictor • X Y dv X iv
Correlation(Pearson Product Moment or r) • Are two variables related? • Car speed & likelihood of getting a ticket • Skinfolds & percent body fat • What happens to one variable when the other one changes? • Linear relationship between two variables • 1 measure of 2 separate variables or 2 measures of 1 variable • Provides support for a test’s validity and reliability
Scatterplot of correlation between pull-ups and chin-ups(direct relationship/+) Chin-ups (#completed) Pull-ups (#completed)
Scatterplot of correlation betweenbody weight and pull-ups(indirect/inverse relationship/-) Pull-ups (#completed) Weight (lb)
Correlation issues • Correlation ≠ causation • -1.00 < r < +1.00 • Coefficient of Determination (r2) (shared variance) • r=.70 r2=.49 49% variance in Y accounted for by X Y dv X iv
Negative correlation possibly due to: • Opposite scoring scales • True negative relationship • Linear or Curvilinear (≠ no relationship; fig 4.6) • Range Restriction (fig 4.7; ↓ r) • Prediction (relationship allows prediction to some degree) • Error of Prediction (for r ≠ 1.0) • Standard Error of Estimate (prediction error)
Limitations of r Figure 4.6 Curvilinear relationship Example of variable? Figure 4.7 Range restriction
Correlation & Prediction IREVIEW • Bivariate nature of correlations • X (iv) & Y (dv) • +/- relationships • Range of r? • Coefficient of Determination (r2) (shared variance) • Coefficient of variation (S/M): 2 data sets • Low V (.1-.2=homo): M accounts for most variability in scores • Curvilinear relationship? Fitness/PA • Correlation/Causation?
Uses of Correlation • Quantify RELIABILITY of a test/measure • Quantify VALIDITY of a test/measure • Understand nature/magnitude of bivariate relationship • Provide evidence to suggest possible causality
Misuses of Correlation • Implying cause/effect relationship • Over-emphasize strength of relationship due to “significant” r
Correlation and prediction % Fat Skinfolds
Sample Correlations Excel document
Standard Error of Estimate(SEE) Average error in the process of predicting Y from XStandard Deviation of error As r ↑, error ↓ As r ↓, error ↑ Is ↑r good? Why/Not? Is ↑ error good? Why/Not?