Statistical Review: Measures of Central Tendency in Frequency Tables
Review of mean, median, mode, geometric mean, and harmonic mean calculations from Chapter 2. Understand distribution graphs and stem-and-leaf plots, alongside interpreting right-skewed distributions. Test your knowledge with practice questions.

Statistical Review: Measures of Central Tendency in Frequency Tables
E N D
Presentation Transcript
Descriptive Statistics Review Probability & Statistics Chapter 2
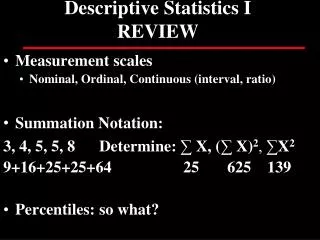
Find the mean of the frequency table (round answer to nearest tenth) Answer: 14.3
Find the median of the frequency table Answer: 14
Find the mode of the frequency table Answer: 14
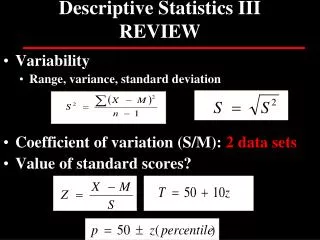
Find the geometric mean (round answer to nearest tenth) Answer: 6.3
Find the harmonic mean (round answer to nearest tenth) Answer: 4.7
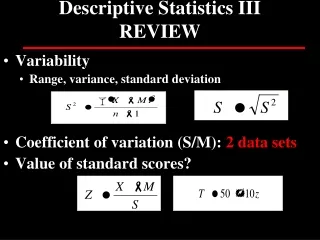
Distribution Graphs • In a right-skewed distribution, you would expect the highest value to be the: • Mode • Range • Mean • Median Answer: C
Stem-and-Leaf Plot • Find the range of the stem-and-leaf plot Key 5|1=5.1 Answer: 6.4