Download

1 / 27
270 likes | 439 Vues
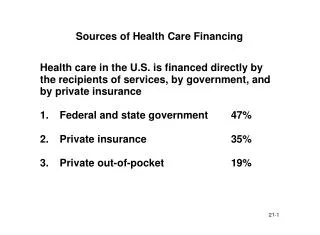
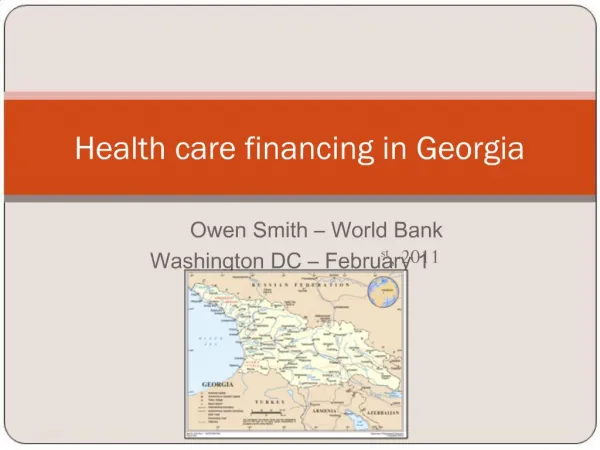
Financing of hospital care in Finland. Unto Häkkinen Centre for Health and Social Economics. Universal and equal availability Public financing 8.2% of GDP (2007) 75% public funding also some 40% of private services are reimbursed Government soft regulation / information guidance.

E N D
Financing of hospital care in Finland Unto Häkkinen Centre for Health and Social Economics Finland
Universal and equal availability Public financing 8.2% of GDP (2007) 75% public funding also some 40% of private services are reimbursed Government soft regulation / information guidance Municipalities responsible for providing health services, social services and basic education 342 with population range from 580 000 to just 150 20 + 1 Central Hospital Districts (owned federations of municipalities) Health care system in Finland Finland
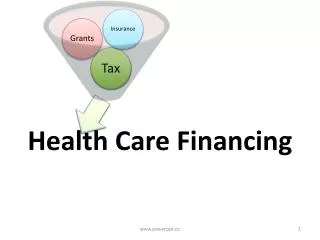
Subsidy State Municipality Tax Tax Hospital District NHI Co-payment Contribution Reimbursement Population/ Employer Patient
Hospital districts (HD) • Responsible for most of hospital care • Managed and funded by municipalities • Each municipality obligated to be a member of a HD • Different contractual or negations mechanism between municipalities and HDs. • The budget of each HD is based on the negotiations and is formally decided by a Council, whose members are appointed by each municipality • The HD council approves the financial statements (such as payment methods and levels of payments (prices)) and makes decisions about major investments Finland
Financing of hospital districts • The payments for municipalities are based on the total budget and the predicted use of services • If the budget is exceeded, the municipalities must cover the deficit from their own revenues, usually by paying higher prices for services. In the case of budgetary surplus, the prices paid by municipalities can be lowered. Major purpose of hospital pricing systems has been to cover the costs of production and to allocate hospital costs fairly between the municipalities financing the provision of services within a HD. Finland
Payment methods • Each HD determines activity based payment methods used to reimburse its hospitals and they vary from district to district. • The trend been consistently moving away from the bed-per-day price towards case-based prices. • Presently 13 out of 21 HDs use DRG-based pricing. The principles and rules for DRG usage vary greatly between hospital districts because there are no national guidelines how to use it. Finland
International comparison • Finnish hospitals are more efficient than hospitals in other Nordic countries. • One possible explanation: the cost control by municipalities (financed by mainly by local taxes) is more effective that that of counties or governments Finland
Confidence limits for efficiency scores for non university hospitals in Nordic countries. Based on pooled DEA (CRS) 1999-2004 Finland
Current Issues: A somewhat greater state involvement and monitoring Earlier Softer regulation/information guidance, which relies on the assumption that the provision of information to municipalities, producers and professionals (doctors) will drive constructive behavioural or system change. Since 2005 • Introduction of clinical guidelines for a wide range of treatments, aimed partly at bringing some convergence across Finland in rates of elective surgical procedures and in the setting of thresholds for admission to waiting lists for procedures. • Introduction of a set of maximum waiting-time targets for non-urgent examinations and treatments at hospitals. Defined hospital treatments, including elective surgery, should be offered within 3-6 months • Collection a fine if a hospital district does not meet the waiting-time targets Finland
Vertical integration Since mid 1990s several local reforms have been conducted to ingrate the service production into single organization in 2008 about 10 % of population lived in areas where most of the primary and secondary care is provided by the same organisation. Current initiative from the Ministry: greater integration of care between health centers and non university hospital districts (government bill 2010, implementation 2011). Finland
Scope and scale Clear trend towards increasing size both producers (hospitals) and purchasers municipalities on voluntary basis: • Three hospitals into a one in capital area in 2007 • In 2009: number of municipalities from 415 to 348 and now 342 Current initiative from the Ministry: The care of diseases requiring highly demanding treatment will be centralized more to 5 special responsibility hospital districts (government bill 2010, implementation 2011). Finland
Patient choice • Current situation: patients do not have a freedom to choose between hospitals • Current initiative from the Ministry: patient can choose (public) hospital from his own special responsibility hospital district, pop about 1 million (government bill 2010, implementation 2011). • Not decided (or even thought) how the municipalities will pay hospitals Finland
Measuring productivity of hospital care: benchmarking project • Joint venture - STAKES & hospital districts 1998-2006, 2007- part of routine statistical system (THL) • Provides versatile data on • Utilisation • Costs • Productivity • From provider and regional perspective Finland
The hospital benchmarking system • A data warehouse containing all patient contacts in hospital and inpatient primary care since 1998 • Output data is grouped using NordDRG, to cover the whole episode of care • Combines cost data with output data (allowing for productivity comparisons) • Gives a process view both from a regional and producer perspective Finland
Available indicators reported in the benchmarking system • Cost efficiency • (productivity, unit costs, use of intermediate services) • Use of services (age- and sex standardized) • Rates for various types of services • Process indicators • (% of bed-days in specialized care/primary care) Finland
Hospital district Hospital Speciality Patient group Measurement levels - Hospital care:Producer perspective Finland
Hospital level productivity in 2008 - central hospitals Finland
New developments in hospital bencmarking at disease level • PERFECT = PERFormance, Effectiveness and Cost of Treatment episodes (since 2006) • A comparative database that allows the treatments and their costs and outcomes to be compared between hospitals , hospital districts and years Finland
BASIC REPORTS RESEARCH FEEDBACK PERFECT DATA BASE THL Hospital discharge register, Hospital productivity (Benchmarking) database SOCIAL INSURANCE INSTITUTION Register on Health and Social Benefits STATISTICS OF FINLAND Cause-of-Death Register OTHER REGISTERS Implant Register on Orthopaedic Endoprostheses, Hospitals patient registers Description of PERFECT-Project Finland
Content of basic reportshttp://www.thl.fi/fi_FI/web/fi/tutkimus/hankkeet/perfect Levels • Hospital Districts (responsible for providing specialist care in Finland) based on the municipality of the patient) • Hospitals (over 50 patients), based on patients treated in a hospital Indicators • Basic information on patients such as number of patients, age structure, co-morbidity (about 40 indicators) • Process indicators describing length of stay, outpatient visits, use of procedures, drugs, cost of care (about 140 indicators) . • Indicators describing outcomes of patients (about 60 indicators) Finland
Current status of Perfect • Acute myocardial infarction (regional level and hospital data available from the years 1998-2007) • Bypass surgery and PTCA (regional and hospital level data under development from years 1998-2007) • Hip Fracture (regional and hospital level data available from years 1999-2007) • Hip and knee replacements (regional and hospital level data available from years 1998-2007) • Very low birth weight infants (regional and hospital level data available from years 2000-2007) • Schizophrenia (regional and hospital level data available from years 1995-2001 cohorts) • Stroke (regional and hospital level data available from years 1999-2007) Finland
Conclusions • Internationally: Finnish decentralised hospital system rather effective producing services, but not yet information on its performance in outcomes • Great regional and hospital level differences in efficiency, cost and outcomes. • New initiatives from government (patient choice) without considering how financing will be arranged • Benchmarking of hospital efficiency and outcomes well developed. Originally initiated by researchers and afterward implemented together with producers (hospitals districts) using financial support from research funds. The information has been increasingly used in local and national decision making Finland