Download
1 / 30
300 likes | 492 Vues
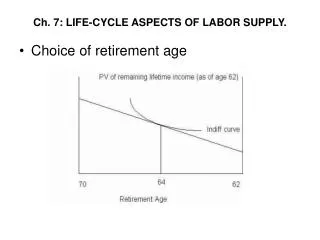
Household and Firm Behavior in the Macroeconomy: A Further Look. Households: Consumption and Labor Supply Decisions The Life-Cycle Theory of Consumption The Labor Supply Decision Interest Rate Effects on Consumption Government Effects on Consumption and Labor Supply: Taxes and Transfers

E N D
Household and Firm Behavior in the Macroeconomy: A Further Look Households: Consumption and Labor Supply DecisionsThe Life-Cycle Theory of Consumption The Labor Supply Decision Interest Rate Effects on Consumption Government Effects on Consumption and Labor Supply: Taxes and Transfers A Possible Employment Constraint on Households A Summary of Household Behavior The Household Sector Since 1970 Firms: Investment and Employment Decisions Expectations and Animal Spirits Profit Maximization Excess Labor and Excess Capital Effects Inventory Investment A Summary of Firm Behavior The Firm Sector Since 1970 Productivity and the Business Cycle The Short-Run Relationship Between Output and Unemployment The Size of the Multiplier Lecture 11
Households: Consumption and Labor Supply Decisions The Life-Cycle Theory of Consumption life-cycle theory of consumption A theory of household consumption: Households make lifetime consumption decisions based on their expectations of lifetime income.
Households: Consumption and Labor Supply Decisions The Life-Cycle Theory of Consumption FIGURE 16.1 Life-Cycle Theory of Consumption In their early working years, people consume more than they earn. This is also true in the retirement years. In between, people save (consume less than they earn) to pay off debts from borrowing and to accumulate savings for retirement. permanent income The average level of a person’s expected future income stream.
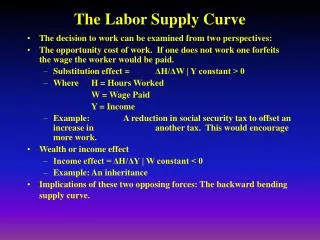
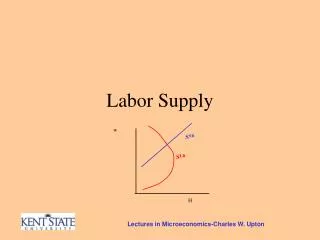
Households: Consumption and Labor Supply Decisions The Labor Supply Decision Households make consumption and labor supply decisions simultaneously. Consumption cannot be considered separately from labor supply, because it is precisely by selling your labor that you earn income to pay for your consumption. The Wage Rate According to the substitution effect of a wage rate increase, a higher wage leads to a larger quantity of labor supplied—a larger workforce. According to the income effect of a wage rate increase, if we assume that leisure is a normal good, people with higher income will spend some of it on leisure by working less.
Households: Consumption and Labor Supply Decisions The Labor Supply Decision Prices nominal wage rate The wage rate in current dollars. real wage rate The amount the nominal wage rate can buy in terms of goods and services. Households look at expected future real wage rates as well as the current real wage rate in making their current consumption and labor supply decisions.
Households: Consumption and Labor Supply Decisions The Labor Supply Decision Wealth and Nonlabor Income nonlabor, or nonwage, income Any income received from sources other than working— inheritances, interest, dividends, transfer payments, and so on. Holding everything else constant (including the stage in the life cycle), the more wealth a household has, the more it will consume, both now and in the future. An unexpected increase in nonlabor income will have a positive effect on a household’s consumption. An unexpected increase in wealth or nonlabor income leads to a decrease in labor supply.
Households: Consumption and Labor Supply Decisions Interest Rate Effects on Consumption A rise in the interest rate leads me to consume less today and save more. This effect is called the substitution effect of an interest rate change. There is also an income effect of an interest rate change on consumption. If a household has positive wealth and is earning interest on that wealth, a fall in the interest rate leads to a fall in interest income.
Households: Consumption and Labor Supply Decisions Government Effects on Consumption and Labor Supply: Taxes and Transfers
Households: Consumption and Labor Supply Decisions A Possible Employment Constraint on Households Households consume less if they are constrained from working. unconstrained supply of labor The amount a household would like to work within a given period at the current wage rate if it could find the work. constrained supply of labor The amount a household actually works in a given period at the current wage rate.
Households: Consumption and Labor Supply Decisions A Possible Employment Constraint on Households Keynesian Theory Revisited In Keynesian theory, current income determines current consumption. It is incorrect to think consumption depends only on income, at least when there is full employment. However, if there is unemployment, Keynes is closer to being correct because income is not determined by households. When there is unemployment, the level of income (at least workers’ income) depends exclusively on the employment decisions made by firms.
Households: Consumption and Labor Supply Decisions A Summary of Household Behavior • The following factors affect household consumption and labor supply decisions: • Current and expected future real wage rates • Initial value of wealth • Current and expected future nonlabor income • Interest rates • Current and expected future tax rates and transfer payments
Households: Consumption and Labor Supply Decisions The Household Sector Since 1970 Consumption FIGURE 16.2 Consumption Expenditures, 1970 I–2007 IV Over time, expenditures on services and nondurable goods are “smoother” than expenditures on durable goods.
Households: Consumption and Labor Supply Decisions The Household Sector Since 1970 Housing Investment FIGURE 16.3 Housing Investment of the Household Sector, 1970 I–2007 IV Housing investment fell during the four recessionary periods since 1970. Like expenditures for durable goods, expenditures for housing investment are postponable.
Households: Consumption and Labor Supply Decisions The Household Sector Since 1970 Labor Supply FIGURE 16.4 Labor Force Participation Rates for Men 25 to 54, Women 25 to 54, and All Others 16 and Over, 1970 I–2007 IV Since 1970, the labor force participation rate for prime-age men has been decreasing slightly. The rate for prime-age women has been increasing dramatically. The rate for all others 16 and over has been declining since 1979 and shows a tendency to fall during recessions (the discouraged- worker effect).
Firms: Investment and Employment Decisions Expectations and Animal Spirits animal spirits of entrepreneurs A term coined by Keynes to describe investors’ feelings. The Accelerator Effect accelerator effect The tendency for investment to increase when aggregate output increases and to decrease when aggregate output decreases, accelerating the growth or decline of output.
Firms: Investment and Employment Decisions Profit Maximization inputs The goods and services that firms purchase and turn into output. plant-and-equipment investment Purchases by firms of additional machines, factories, or buildings within a given period. labor-intensive technology A production technique that uses a large amount of labor relative to capital. capital-intensive technology A production technique that uses a large amount of capital relative to labor.
Firms: Investment and Employment Decisions Excess Labor and Excess Capital Effects excess labor, excess capital Labor and capital that are not needed to produce the firm’s current level of output. adjustment costs The costs that a firm incurs when it changes its production level— for example, the administration costs of laying off employees or the training costs of hiring new workers.
Firms: Investment and Employment Decisions Inventory Investment inventory investment The change in the stock of inventories. The Role of Inventories Stock of inventories (end of period) = Stock of inventories (beginning of period) + Production - Sales
Firms: Investment and Employment Decisions Inventory Investment The Optimal Inventory Policy desired, or optimal, level of inventories The level of inventory at which the extra cost (in lost sales) from lowering inventories by a small amount is just equal to the extra gain (in interest revenue and decreased storage costs).
Firms: Investment and Employment Decisions A Summary of Firm Behavior • The following factors affect firms’ investment and employment decisions: • Firms’ expectations of future output • Wage rate and cost of capital (the interest rate is an important component of the cost of capital) • Amount of excess labor and excess capital on hand
Firms: Investment and Employment Decisions A Summary of Firm Behavior • The most important points to remember about the relationship among production, sales, and inventory investment are • Inventory investment—that is, the change in the stock of inventories—equals production minus sales. • An unexpected increase in the stock of inventories has a negative effect on future production. • Current production depends on expected future sales.
Firms: Investment and Employment Decisions The Firm Sector Since 1970 Plant-and-Equipment Investment FIGURE 16.5 Plant-and-Equipment Investment of the Firm Sector, 1970 I–2007 IV Overall, plant-and-equipment investment declined in the four recessionary periods since 1970.
Firms: Investment and Employment Decisions The Firm Sector Since 1970 Employment FIGURE 16.6 Employment in the Firm Sector, 1970 I–2007 IV Growth in employment was generally negative in the four recessions the U.S. economy has experienced since 1970.
Firms: Investment and Employment Decisions The Firm Sector Since 1970 Inventory Investment FIGURE 16.7 Inventory Investment of the Firm Sector and the Inventory/Sales Ratio, 1970 I–2007 IV The inventory/sales ratio is the ratio of the firm sector’s stock of inventories to the level of sales. Inventory investment is very volatile.
Productivity and the Business Cycle productivity, or labor productivity Output per worker hour; the amount of output produced by an average worker in 1 hour. FIGURE 16.8 Employment and Output over the Business Cycle In general, employment does not fluctuate as much as output over the business cycle. As a result, measured productivity (the output- to-labor ratio) tends to rise during expansionary periods and decline during contractionary periods.
Productivity and the Business Cycle Productivity in the Long Run Productivity figures can be misleading when used to diagnose the health of the economy over the short run, because business cycles can distort the meaning of productivity measurements. Output per worker falls in recessions because firms hold excess labor during slumps. Output per worker rises in expansions because firms put the excess labor back to work. Neither of these conditions has anything to do with the economy’s long-run potential to produce output.
The Short-Run Relationship Between Output and Unemployment Okun’s Law The theory, put forth by Arthur Okun, that in the short run the unemployment rate decreases about 1 percentage point for every 3 percent increase in real GDP. Later research and data have shown that the relationship between output and unemployment is not as stable as Okun’s “Law” predicts.
The Short-Run Relationship Between Output and Unemployment Let E denote the number of people employed, let L denote the number of people in the labor force, and let u denote the unemployment rate. In these terms, the unemployment rate is u = 1 – E/L The unemployment rate is 1 minus the employment rate, E/L. discouraged-worker effect The decline in the measured unemployment rate that results when people who want to work but cannot find work grow discouraged and stop looking, dropping out of the ranks of the unemployed and the labor force.
The Size of the Multiplier • The value of the multiplier in reality is smaller than the simple multiplier. We can now summarize why. • There are automatic stabilizers. • The interest rate and the crowding-out effect. • The effect of expansionary policy on the price level. • The fact that firms hold excess capital and excess labor. • There are inventories. • There are people’s expectations. The Size of the Multiplier in Practice In practice, the multiplier probably has a value of around 1.4. Its size also depends on how long ago the spending increase began.
REVIEW TERMS AND CONCEPTS accelerator effect adjustment costs animal spirits of entrepreneurs capital-intensive technology constrained supply of labor desired, or optimal, level of inventories discouraged-worker effect excess capital excess labor inputs inventory investment labor-intensive technology life-cycle theory of consumption nominal wage rate nonlabor, or nonwage, income Okun’s Law permanent income plant-and-equipment investment productivity, or labor productivity real wage rate unconstrained supply of labor