Selecting Your Sample
Selecting Your Sample. Determining the Sample Size. To calculate the specific sample size required for your site you need the following information: Level of Confidence Acceptable margin of error Determine the starting or baseline levels of the indicators (diabetes if doing Step 3)


Selecting Your Sample
E N D
Presentation Transcript
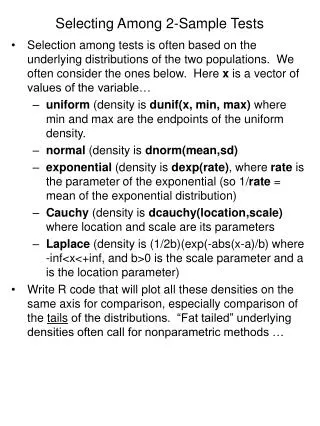
Determining the Sample Size • To calculate the specific sample size required for your site you need the following information: • Level of Confidence • Acceptable margin of error • Determine the starting or baseline levels of the indicators (diabetes if doing Step 3) • Design effect
Level of Confidence • The level of confidence for cross sectional studies is 95%. • For example, if you have a prevalence of 12.0% and a 95% CI of (11.0 – 13.0), then you would be able to say that in 95 out of every 100 studies, the prevalence of factor X would be between 11.0 and 13.0. • 95% CI translates into 1.96 for calculating sample size.
Acceptable Margin of Error • The margin of error is the difference between the population proportion and the sample proportion. • The standard choices range from 1% and 5% of the population.
Determining the Baseline Level for Indicators • Select the lowest prevalence of the indicators that you are surveying. • If you are doing Step 3, this is most likely going to be diabetes.
Design Effect • Sample size is commonly calculated assuming a simple random sample. • Provides a correction for the loss of sampling efficiency from using cluster sampling. • If no information on previous surveys is available, assume a DE of 2.
Equation for Calculating Sample Size n
Equation for Calculating Z = Level of confidence P = Baseline level for indicator E = Margin of error n
Create Table of Information Z = 1.96 E = 0.05 P = 0.10
Equation for Calculating Z=1.96 E=0.05 P= 0.1 n
Equation for Calculating = 138.3 Sample Size
Equation for Calculating = 138.1 Number will only change if the sample size exceeds 5% of the total population.
Including Age-Sex Stratum Sample size= 138.1 • Take into account • that we want to make age-sex comparisons • cluster sampling = Sample size * (number age-sex stratum) * Design effect Sample size = 138.1 * 8 * 2 = 2,211
Adjust Sample Size for Non Response • Sample Size as calculated (2,211) adjusts for cluster sample design. • Assume 80% response rate and inflate sample size and accordingly. • = (2,211*.20) = 442 • Final Sample size = 2,211 + 442 = 2,653
Add Districts to PSU Spreadsheet • Add names of districts and the estimated size of each district.
Select Number of Clusters • Type in the number of clusters to select. • Type in the random number.
Sample Distribution Sample = Total sample size * Proportion of population Total Castries =2,653 * 0.5511
Determine Cluster Size • Assume 50 participants per cluster
Clustering SSU Spreadsheet • Allows selection of settlements by PPS sampling • Duplicate Spreadsheet until have five spreadsheets (number of districts selected)
Record Names of Selected Districts • Will see spreadsheets at the bottom of the workbook. • Rename the spreadsheets to reflect the names of the selected districts.
Select Settlements for Each District • Select Anse La Raye settlements. • Need to select three (3) clusters.
Type in Settlements and Estimated Population Size • Label the settlements with either numbers or names. • Type in the estimated size of the sampling units.
Determine the Number of Clusters • Type in the number of clusters to select. • Type in the random number.
Anse La Raye • Cluster # 3 is associated with Au Tabor Hill. • Au Tabor Hill has less than 50 households, so combine it with settlement #4 and select 50 households at random from the combined list.
Anse La Raye • Cluster #15 is associated with Millet Caico. • Millet Caico has 64 households.
Select the Settlements for the Remaining Districts • Enter the settlement information for each district into the corresponding spreadsheet. • Use the table below to determine the number of clusters to select:
Select Households from Each Settlement • Use the Rand Hhold spreadsheet to select households to sample randomly. • Determine the number of households in each settlement • If you have an address list with each household by address. • Otherwise, when you are visiting a settlement, list all the households by location.
Duplicate Rand Hhold for Number of Settlements Selected • There are 52 clusters in the sample. • Duplicate the Rand Hhold spreadsheet 51 times using the Duplicate Spreadsheet button.
Rename Rand Hhold for Selected Settlements • You will see spreadsheets at the bottom of the workbook: • Rename the spreadsheets to reflect the names of the selected districts:
Select Households for each Settlement • Determine how many households there are in each settlement. • List all the households on the Rand Hhold spreadsheet and randomly select 50 households. • One participant will be selected from each household.
Millet Caico: Rand Hhold Millet Caico has 64 households, of which 50 will be selected.
Sampling Options • This example has shown only one possibility. There are many other ways to draw and divide the same population. • You could divide the sample into constituencies instead of districts. • You could select all the districts to sample and then select a smaller, more representative group from all the districts.
Determining Your Sample • Your sample will be a balance between • What information is available (sampling frame) • The scope of the survey • The budget (finance and human resources)
Statistical Assistance • You should always have someone review your sampling methodology. • If you need assistance, contact CAREC or PAHO or WHO-Geneva.