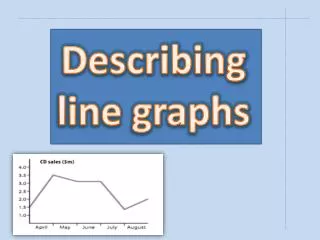
Describing Situations From Graphs
Describing Situations From Graphs. 1. 6. 5. 4. 3. 2. 6. 5. 4. 1. 2. 3. Graphs of Real-Life Situations (1). Intro. Discuss what happens to d as t increases in each of the graphs below, then match each graph to a statement on the right. d. d. d increases steadily. d.


Describing Situations From Graphs
E N D
Presentation Transcript
1 6 5 4 3 2 6 5 4 1 2 3 Graphs of Real-Life Situations (1) Intro Discuss what happens tod as t increases in each of the graphs below, then match each graph to a statement on the right. d d d increases steadily d d remains constant d decreases rapidly t t t d increases rapidly d increases steadily, then decreases rapidly d d d d decreases steadily t t t Remember:The steeper the line, the faster the rate of increase/decrease.
4 1 2 3 1 2 4 3 Graphs of Real-Life Situations (2) Discuss what happens to p as q increases in each of the graphs below, then match each graph to a statement on the right. p increases quickly at first, then more slowly p p p increases slowly at first, then more quickly q q p increases slowly at first, then more quickly then slowly again p p p increases quickly at first, then more slowly, then quickly again q q
Experiment A test tube containing a chemical liquid is used in an experiment. During the experiment the depth d of the liquid changes with time t. Match the different parts of the graph to the statements below. d 1 2 3 5 4 4 3 2 1 5 t Some liquid is poured out quickly. Liquid is added slowly to the test tube. Some liquid is poured in quite quickly. The level of the liquid remains constant. The test tube is emptied. Graphs of Real-Life Situations (3)
Population Population Population Population 1955 1955 1955 1955 2005 2005 2005 2005 3 4 2 1 Graphs of Real-Life Situations (4) Population The graphs below show how the population of four small African countries changed over a 50 year period. Match each graph to a statement. The population increased steadily over the period. The population increased slowly at first, but then increased more quickly. The population declined steadily over the period. The population increased quickly at first, but then increased more slowly.
Archimedes Relaxes in bath. 3 Pulls the plug. Depth of Water 4 2 1 5 6 7 Cold tap turned off, gets undressed. Gets into bath. Time Gets out of bath. Turns off hot tap. Hot and cold taps turned on. Graphs of Real-Life Situations (5) The graph below shows the variation in the depth of water as Archie takes his early morning bath. Match the different parts of the graph to the statements shown.
3 4 5 2 1 6 Graphs of Real-Life Situations (6) Bill walks through a snowy field on his way to the store at 25 m/min Bill realizes he is late and runs home more quickly Bill starts walking home slowly, carrying a heavy bag of milk Bill spends 4 minutes shopping at the store Bill walks on the sidewalk at 50 m/min until he reaches the store Bill starts walking on the sidewalk on his way to the store at 50 m/min
Water 1 D C B A d d d d t t t t 4 3 1 2 Water is poured into each of the containers below at a constant rate of 250 ml per second. The graphs show how the depth d of the water varies with time t. Match the container to its corresponding graph.
B C A D d d d d t t t t 4 3 1 2 Water is poured into each of the containers below at a constant rate of 250 ml per second. The graphs show how the depth d of the water varies with time t. Match the container to its corresponding graph.
B C A D d d d d t t t t 4 3 1 2 Water is poured into each of the containers below at a constant rate of 250 ml per second. The graphs show how the depth d of the water varies with time t. Match the container to its corresponding graph.
B C A D d d d d t t t t 4 3 1 2 Water is poured into each of the containers below at a constant rate of 250 ml per second. The graphs show how the depth d of the water varies with time t. Match the container to its corresponding graph.
B C A D d d d d t t t t 4 3 1 2 Water is poured into each of the containers below at a constant rate of 250 ml per second. The graphs show how the depth d of the water varies with time t. Match the container to its corresponding graph.
d d d d B C A D d d d d h h h h 4 3 1 2 A liquid is poured into each of the containers below. The graphs show how the surface diameter d varies as the height of the liquid h increases. Match each container with its corresponding graph. Chemical 1
d d d d B C A D d d d d h h h h 4 3 1 2 A liquid is poured into each of the containers below. The graphs show how the surface diameter d varies as the height of the liquid h increases. Match each container with its corresponding graph.