Download
1 / 24
240 likes | 352 Vues
This session, held on September 24, 2008, at HPEC08, aims to assess the necessary infrastructure (hardware, software, and support) for multicore open systems architectures. It examines current progress and outlines future requirements. Featuring expert insights from notable speakers, including Mr. Markus Levy, it discusses historical performance trends in semiconductor technology and the implications for multicore processors. The session encourages open dialogue, seeking input on challenges and opportunities in multicore architecture developments.

E N D
Panel Session:Paving the Way for Multicore Open Systems Architectures James C. Anderson MIT Lincoln Laboratory HPEC08 Wednesday, 24 September 2008 This work was sponsored by the Department of the Air Force under Air Force Contract #FA8721-05-C-0002. Opinions, interpretations, conclusions and recommendations are those of the author, and are not necessarily endorsed by the United States Government. Reference to any specific commercial product, trade name, trademark or manufacturer does not constitute or imply endorsement.
Objective & Schedule • Objective: Assess the infrastructure (hardware, software & support) that enables use of multicore open systems architectures • Where are we now? • What needs to be done? • Schedule • 1525: Overview • 1540: Guest speaker: Mr. Markus Levy • 1600: Introduction of the panelists • 1605: Previously submitted questions for the panel • 1635: Open forum • 1655: Conclusions & the way ahead • 1700: Closing remarks & adjourn
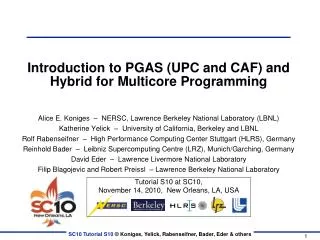
Paving the Way forMulticore Open Systems Architectures Tools Multicore µPs Methodologies Design paths diverged ca. 2005 Uni-processors
But First, A Few Infrastructure Issues Performance was doubling every 18 months (Moore’s Law), but not anymore
2000 International Technology Roadmap for Semiconductors (ITRS00) 40 In 2000, ITRS00 predicted a slightly lower improvement rate vs. historical Moore’s Law for the 2008-2014 timeframe 30 On-chip local clock, GHz 20 ITRS00 10 Year (Node) 2013 (32nm) 2007 (65nm) 2010 (45nm) 2016 (22nm) • ~3.5X throughput every 3 yrs predicted for multiple independent cores (~same as 4X every 3 yrs for historical Moore’s Law) • 1.4X clock speed every 3 yrs for constant power • 2.5X transistors/chip every 3 yrs (partially driven by economics) for constant chip size (chip size growth ended ~1998)
2001-2002 International Technology Roadmap for Semiconductors (ITRS01-02) 40 ITRS01-02 predicted substantially lower improvement rate vs. ITRS00, but higher clock speeds 30 ITRS01-02 On-chip local clock, GHz 20 ITRS00 10 Year (Node) 2013 (32nm) 2007 (65nm) 2010 (45nm) 2016 (22nm) • 2.8X throughput every 3 yrs predicted for multiple independent cores • 1.4X clock speed every 3 yrs for constant power (same as ITRS00) • 2X transistors/chip every 3 yrs for constant chip size (less than ITRS00)
2003-2006 International Technology Roadmap for Semiconductors (ITRS03-06) 40 ITRS03-06 predicted same improvement rate as ITRS01-02, but even higher clock speeds ITRS03-ITRS06 1.4X increase 30 ITRS01-02 On-chip local clock, GHz 20 ITRS00 10 Year (Node) 2013 (32nm) 2007 (65nm) 2010 (45nm) 2016 (22nm) • 2.8X throughput every 3 yrs predicted for multiple independent cores • 1.4X clock speed every 3 yrs for constant power (same as ITRS00-02) • 2X transistors/chip every 3 yrs for constant chip size (same as ITRS01-02)
2007 International Technology Roadmap for Semiconductors (ITRS07) 40 ITRS07 predicts lower clock speeds & improvement rate vs. ITRS00-06 ITRS03-ITRS06 30 ITRS01-02 On-chip local clock, GHz 20 4.3X reduction ITRS00 ITRS07 10 Year (Node) 2013 (32nm) 2007 (65nm) 2010 (45nm) 2016 (22nm) • ~2.5X throughput every 3 yrs predicted for multiple independent cores • 1.23X clock speed every 3 yrs for constant power (less than ITRS00-06) • 2X transistors/chip every 3 yrs for constant chip size (same as ITRS01-06)
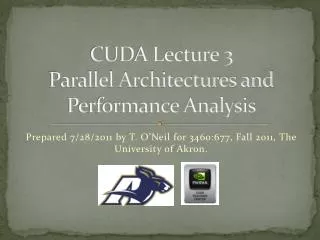
COTS Compute Node (processor, memory & I/O) Performance History & Projections (2Q08) 100 10 nm 2.5X in 3 yrs improvement rate for multicore µPs & COTS ASICs 10 2.5X in 3 yrs improvement rate for SRAM-based FPGAs IBM Cell (90nm) 2X in 3 yrs improvement rate for general-purpose uni-processor µPs GFLOPS/W (billion 32-bit floating point operations per sec-watt for computing 1K-point complex FFT) 1 100 nm Intel i860 µP (1µm) 0.1 4X in 3 yrs improvement rate for all technologies Projected improvement rates, although smaller than historical values, are still substantial 1000nm 0.01 2008 2023 1993 Year
Notional Cost (cumulative) & Schedule for COTS 90nm Cell Broadband Engine Sony exits future Cell development after investing $1.7B 1000 Technology evaluation systems shipped Austin (Texas) design center opens ($400M joint investment in Cell design) 100 Development Cost (millions of $) 10 Cell Broadband Engine: 205 GFLOPS (peak, 32-bit) @ 100W (est.), ~2 GFLOPS/W Cell 1 IBM, Sony & Toshiba hold architectural discussions 0.1 2002 2000 2006 2008 2004 Year
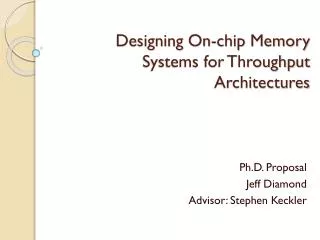
Multicore Open Systems Architecture Example • LEON3 • 32-bit SPARC V8 processor developed by Gaisler Research (Aeroflex as of 7/14/08) for the European Space Agency • Synthesizable VHDL (GNU general public license) & documentation downloadable from www.gaisler.com • Open source software support (embedded Linux, C/C++ cross-compiler, simulator & symbolic debugger) • 0.25µm LEON3FT • Commercial fault-tolerant implementation of LEON3 • 75 MFLOPS/W (150 MIPS & 30 MFLOPS @ 150 MHz for 0.4W) • 90nm quad-core LEON3FT • System emulated with a single SRAM-based FPGA • 133 MFLOPS/W (4x500 MIPS & 4x100 MFLOPS for 3W) • Each core occupies <1mm2 including caches • MOSIS fabricates 65nm & 90nm die up to 360mm2 (IBM process) How can we improve performance (FLOPS/W), which lags COTS by up to 9 yrs (15X) in this example?
Notional Cost (cumulative) & Schedule for 90nm LEON3FT Multicore Processor $3M estimated development cost is mostly staff expense, with schedule determined by foundry 1000 100 Development Cost (millions of $) 10 90nm quad-core LEON3FT 1 0.25µm LEON3FT 65nm fab access 0.1 2008 2006 2004 2002 2000 Year
Objective & Schedule • Objective: Assess the infrastructure (hardware, software & support) that enables use of multicore open systems architectures • Where are we now? • What needs to be done? • Schedule • 1525: Overview • 1540: Guest speaker: Mr. Markus Levy • 1600: Introduction of the panelists • 1605: Previously submitted questions for the panel • 1635: Open forum • 1655: Conclusions & the way ahead • 1700: Closing remarks & adjourn
Panel Session: Paving the Way for Multicore Open Systems Architectures Moderator: Dr. James C. Anderson MIT Lincoln Laboratory Prof. Saman Amarasinghe MIT Computer Science & Artificial Intelligence Laboratory (CSAIL) Mr. Markus Levy The Multicore Association & The Embedded Microprocessor Benchmark Consortium (EEMBC) Dr. Steve Muir Chief Technology Officer Vanu, Inc. Dr. Matthew Reilly Chief Engineer SiCortex, Inc. Mr. John Rooks Air Force Research Laboratory (AFRL/RITC) Emerging Computing Technology Panel members & audience may hold diverse, evolving opinions
Objective & Schedule • Objective: Assess the infrastructure (hardware, software & support) that enables use of multicore open systems architectures • Where are we now? • What needs to be done? • Schedule • 1525: Overview • 1540: Guest speaker: Mr. Markus Levy • 1600: Introduction of the panelists • 1605: Previously submitted questions for the panel • 1635: Open forum • 1655: Conclusions & the way ahead • 1700: Closing remarks & adjourn
Conclusions & The Way Ahead • Despite industry slowdown, embedded processors are still improving exponentially (2/3 of historical Moore’s Law rate) • Although performance improvements in multicore designs (2.5X every 3 yrs) continue to outpace those of uni-processors (2X every 3 yrs), the “performance gap” is less than previously projected • New tools and methodologies will be needed to maximize the benefits of using multicore open systems architectures • Power & packaging issues • Cost & availability issues • Training & ease-of-use issues • Platform independence issues • Although many challenges remain in reducing the performance gap between highly specialized systems vs. multicore open systems architectures, the latter will help insulate users from manufacturer-specific issues Success still depends on ability of foundries to provide smaller geometries & increasing speed for constant power (driven by large-scale COTS product economics)
COTS ASIC: 90nm IBMCell Broadband Engine (4Q06) • 100W (est.) @ 3.2 GHz • 170 GFLOPS sustained for 32-bit flt pt 1K cmplx FFT (83% of peak) • 16 Gbyte memory options (~10 FLOPS/byte) • COTS Rambus XDR DRAM (Cell is designed to use only this memory) • 256 chips • 690W (note: Rambus devices may not be 3D stackable due to 2.7W/chip power consumption) • Non-COTS solution: Design a bridge chip ASIC (10W est.) to allow use of 128 DDR2 SDRAM devices (32W) • 128 chips in 3D stacks to save space (0.25W/chip) • Operate many memory chips in parallel • Buffer to support Rambus speeds • Increased latency vs. Rambus • 40W budget for external 27 Gbytes/sec simultaneous I&O (using same non-COTS bridge chip to handle I/O with Cell) • Single non-COTS CN (compute node) using DDR2 SDRAM • 170 GFLOPS sustained for 200W (182W est. for CN plus 18W for 91% efficient DC-to-DC converter) • 0.85 GFLOPS/W & 56 GFLOPS/L
COTS Compute Node Performance History & Projections (2Q08) 100 16nm Texas Memory Systems TM-44 Blackbird ASIC (180nm) Intel Polaris (65nm) 22nm 2.5X in 3 yrs improvement rate for SRAM-based FPGAs, COTS ASICs & multicore µPs 16nm Virtex-4 (90nm) 10 Clearspeed CS301 ASIC (130nm) Motorola MPC7400 PowerPC RISC with AltiVec (180-220nm) IBM Cell (90nm) 2X in 3 yrs improvement rate for general-purpose uni-processor µPs 4X in 3 yrs Catalina Research Pathfinder-1 ASIC (350nm) GFLOPS/W (billion 32-bit floating point operations per sec-watt for computing 1K-point complex FFT) 1 Compute Node includes FFT (fast Fourier transform) processor, memory (10 FLOPS/byte), simultaneous I&O (1.28 bits/sec per FLOPS) & DC-to-DC converter Analog Devices SHARC DSP (600nm) Virtex II (150nm) MPC7448 (90nm) 0.1 MPC7410 (180nm) Xilinx Virtex FPGA (180nm) Freescale MPC7447A (130nm) Intel i860 µP (1000nm) 0.01 2013 2023 2003 1993 Year
World’s Largest Economies: 2000 vs. 2024 2000 population 2000 GDP* 6 billion total 2024population 2024GDP* 8 billion total “Europe’s Top 5” are Germany, Great Britain, France, Italy & Spain * Gross domestic product (purchasing power parity) U.S. population grows by 1/3 & income shrinks from 5X to <4X world average
Highest-performance COTS (commercial off-the-shelf) ADCs (analog-to-digital converters), 3Q08 .1 Thermal noise (~0.5 bit/octave) 2003-2007: ~0.25 bit/yr @ 400 MSPS Max processing gain w/ linearization Aperture uncertainty (~1 bit/octave) 2000-2007: 2X speed in 6.75 yrs (but up to 0.5 bit processing gain is more than offset by loss of 1 effective bit) Historic device-level improvement rates may not be sustainable as technical & economic limits are approached
SFDR (spur-free dynamic range) for Highest-performance COTS ADCs, 3Q08 .1 3dB/octave 6dB/octave SFDR performance often limits ability to subsequently achieve “processing gain”
Energy per Effective Quantization Level for Highest-performance COTS ADCs, 3Q08 .1 Recent power decrease (driven by mobile devices market) from smaller geometry & advanced architectures
Resolution Improvement Timeline forHighest-performance COTS ADCs, 1986-2008 10,000 Non-COTS chip set (ENOB=4.6 @ 12 GSPS) 1000 6- to 8-bit (ENOB>4.3) 100 10-bit (ENOB>7.6) Sampling Rate (MSPS) 12-bit (ENOB>9.8) 10 14-bit (ENOB>10.9) 1 16-bit (ENOB>12.5) 24-bit (ENOB>15.3) 0.1 86 88 96 94 90 92 02 04 98 00 06 08 Year