Download
1 / 46
460 likes | 718 Vues
Not FDIC Insured • May Lose Value • No Bank Guarantee. Rising Rates Make Headlines. “Interest Rates Have Nowhere to Go but Up”. “Fed Faces Tough Sell on Low-Rate Strategy”. “Will Rising Rates Upend Your Bond Fund?”. “Bonds Taking a Beating, Interest Rates Set to Rise”.

E N D
Rising Rates Make Headlines “Interest Rates Have Nowhere to Go but Up” “Fed Faces Tough Sell on Low-Rate Strategy” “Will Rising Rates Upend Your Bond Fund?” “Bonds Taking a Beating, Interest Rates Set to Rise” “Higher Interest Rates Are Coming. Here’s Who Wins and Who Loses.” Time Inc. SEPTEMBER 16, 2013 SEPTEMBER 6, 2012 MARCH 23, 2015 April 10, 2010 April 8, 2011 The new york times THE WALL STREET jOURNAL Us news & world report Seeking alpha
RISING RATES WHAT YOU NEED TO KNOW
Today’s Agenda What Drives Interest Rates? Not All Fixed Income Is Created Equal The Case for Convertibles What About Stocks? The Value of Active Management
What Drives Interest Rates?
Rising Interest Rates Have an Upside Too PROS CONS • A sign inflation is picking up • Higher borrowing costs • Decline in bond prices • A sign of economic growth • Potential increase in dividends/ interest payments over time • Opportunity to reinvest at higher rates
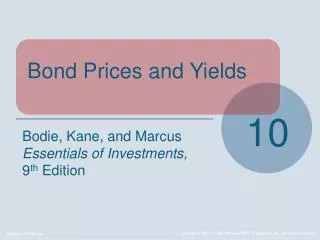
What a Yield Curve Tells Us Treasury Yield Curve as of December 31, 2018 This chart is for illustrative purposes only and does not reflect the performance of any Franklin Templeton fund. Past performance does not guarantee future results. Source: Bloomberg, Federal Reserve.
What Drives Interest Rates? Treasury Yield Curve as of December 31, 2018 The Fed The Market Fed Funds Rate 2.50% This chart is for illustrative purposes only and does not reflect the performance of any Franklin Templeton fund. Past performance does not guarantee future results. Source: Bloomberg, Federal Reserve.
Different Factors Drive Different Parts of the Curve Long-term Rates Short-term Rates • Macroeconomic Events • Risk Appetite and Premiums • Inflation Expectations • Supply and Demand • Fed Monetary Policy
The Fed Focuses on Unemployment and Inflation The Fed’s Dual Mandate Maximum employment Stable prices September 30, 2010–December 31, 2018 Unemployment 3.9% Inflation 2.2% Inflation Unemployment Rate Source: Bloomberg, Federal Reserve. US CPI represented by Urban Consumers Less Food & Energy Year-over-Year.
Short-Term and Long-Term Rates Do Not Necessarily Move in Tandem 10-Year US Treasury Yield vs. Fed Funds Target Rate January 31, 1993–December 31, 2018 9/30/93–12/31/94 Fed Funds Rate: +250 bps 10-Yr UST: +245 bps 9/30/98–1/31/00 Fed Funds Rate: +25 bps 10-Yr UST: +185 bps 5/31/03–6/30/06 Fed Funds Rate: +400 bps 10-Yr UST: +154 bps 7/31/12–1/31/14 Fed Funds Rate: +0 bps 10-Yr UST: +133 bps 7/31/16–12/31/18 Fed Funds Rate: +200 bps 10-Yr UST: +133 bps % Rising Rate Period Fed Funds Target 10-Year US Treasury Yield This chart is for illustrative purposes only and does not reflect the performance of any Franklin Templeton fund. Past performance does not guarantee future results. Sources: Bloomberg, Federal Reserve H.15 Report.
Inflation Has Historically Influenced Long-Term Rates 10-Year US Treasury Yield vs. Core CPI Year-over-Year January 31, 1958–December 31, 2018 Core CPI (YoY) 10-Year US Treasury Yield Source: Bloomberg, Federal Reserve H.15 Report.
GDP Growth May Also InfluenceLong-Term Rates 10-Year US Treasury Yield vs. GDP Growth December 31, 1962–December 31, 2018 GDP Rolling 3-Yr 10-Year US Treasury Yield Source: Bloomberg, Federal Reserve H.15 Report.
Bond Prices and Yields Have an Inverse Relationship This chart is for illustrative purposes only and does not reflect the performance of any Franklin Templeton fund. Past performance does not guarantee future results..
15 Changes in Risk Appetite Can Also Impact Long-Term Treasury Rates 10-Year US Treasury Yields During Risk On/Risk Off Periods 2008–2018 Risk On 10-Year US Treasury Yield Sources: Risk On/Risk Off Periods: Ned Davis Research; 10-Year US Treasury Yields: Federal Reserve H.15 Report.
The Importance of Fixed Income Diversification Annual Total Returns of Key Fixed Income Sectors 1994–2017 Past performance does not guarantee future results. This chart is for illustrative purposes only and does not reflect the performance of any Franklin Templeton fund. Diversification does not guarantee a profit or protect against loss. Treasuries, if held to maturity, offer a fixed rate of return and fixed principal value; their interest payments and principal are guaranteed. Source: Morningstar. High-Yield Bonds are represented by Credit Suisse High Yield Index; Emerging Markets Debt are represented by J.P. Morgan Emerging Market Bond Index Global; Floating-Rate Loans are represented by Credit Suisse Leveraged Loan Index; International Bonds are represented by FTSE World Government Bond Index Non-US; Global Bonds are represented by FTSE World Government Bond Index; TIPS are represented by Bloomberg Barclays US TIPS Index; Municipal Bonds are represented by Bloomberg Barclays Municipal Bond Index; Mortgage-Backed Securities are represented by Bloomberg Barclays US MBS Index; Asset-Backed Securities are represented by Bloomberg Barclays Asset-Backed Securities Index; Investment-Grade Corporate Bonds are represented by Bloomberg Barclays US Corporate Investment Grade Index; Short-Term Government Bonds are represented by Bloomberg Barclays US Government 1–2 Year Index; Agencies are represented by Bloomberg Barclays US Agency Index; 10-Year US Treasury Bonds are represented by Payden & Rygel's 10-Year US Treasury Index (1994-2015), Citigroup 10-Year US Treasury Index (2016-current); Preferreds are represented by BofAML Preferred Stock Fixed Rate Index. Indexes are unmanaged and one cannot invest directly in an index. Index returns do not reflect any fees, expenses or sales charges.
Fixed Income Sectors That Tend to Have Lower Interest Rate Sensitivity Credit-Oriented Strategies Stronger correlation to the overall economic outlook and corporate earnings landscape than interest rates. Short-Duration Strategies Typically have lower sensitivity to interest rate changes than their longer-duration counterparts. Can capitalize on the higher income from rising rates more quickly than longer duration securities. Global/International Strategies Offer diversification through non-US dollar yield curves and currencies. Can seek to capitalize on differing business cycles and economic conditions present around the world.
Non-Investment Grade Credit Sectors Have Had Negative Correlations to Treasuries Correlation Comparison 5-YearPeriod Ended December 31, 2018 -1 = Perfect Negative Correlation; 0 = No Correlation; +1 = Perfect Positive Correlation This chart is for illustrative purposes only and does not reflect the performance of any Franklin Templeton fund. Past performance does not guarantee future results. Treasuries, if held to maturity, offer a fixed rate of return and fixed principal value; their interest payments and principal are guaranteed. Source: Morningstar. US Treasuries represented by the FTSE 10-year Treasury Benchmark; High Yield represented by Credit Suisse HY USD; Bank Loans represented by the Credit Suisse Leveraged Loan Index. Indexes are unmanaged and one cannot invest directly in an index. Index returns do not reflect any fees, expenses or sales charges.
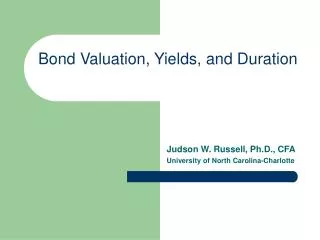
20 Duration Defined Duration is the standard measure of a bond’s interest rate sensitivity. It estimates the expected percentage price change for every percentage point change in interest rates. x 6 (duration) = 6% (price decline) Example: 1% (interest rate rise)
Short-Duration Investments Are Generally Less Impacted by Rising Rates Short-Duration Strategies Include: • Short-Term Government Bonds • Floating-Rate Bank Loans Short-Duration Sector Performance vs. 10-Year Treasuries During Periods of Rising Rates Annualized Performance 12/31/08–4/30/10 This chart is for illustrative purposes only and does not reflect the performance of any Franklin Templeton fund. Past performance does not guarantee future results. Treasuries, if held to maturity, offer a fixed rate of return and fixed principal value; their interest payments and principal are guaranteed. Source: Morningstar. 10-Year US Treasury Bonds are represented by Payden & Rygel’s 10-Year US Treasury Index; Short-Term Government Bonds are represented by Barclays US Government 1–2 Year Index; Floating-Rate Loans are represented by Credit Suisse Leveraged Loan Index. Indexes are unmanaged and one cannot invest directly in an index. Index returns do not reflect any fees, expenses or sales charges.
Short-Duration Bonds Have Been Less Volatile Short-Duration Bonds Have Had Relatively Lower Volatility 10-Year Annualized Standard Deviation As of December 31, 2018 This chart is for illustrative purposes only and does not reflect the performance of any Franklin Templeton fund. Past performance does not guarantee future results. Source: Morningstar. Indexes are unmanaged and one cannot invest directly in an index. Index returns do not reflect any fees, expenses or sales charges. Volatility is measured by the annualized standard deviation of monthly returns.
International Bond Markets Each Have Their Own Interest Rate Environments Top World Bond Markets Calendar Year Returns 2014–2018 This chart is for illustrative purposes only and does not reflect the performance of any Franklin Templeton fund. Past performance does not guarantee future results. Source: Morningstar, Citigroup. All country and Eurozone returns are represented by Citigroup World Government Bond Index and Additional Markets. Returns are based on unhedged USD. Indexes are unmanaged and one cannot invest directly in an index. Index returns do not reflect any fees, expenses or sales charges.
Example 1:Rising Rates Across the Curve Increases Fed Funds Rate: 250 bps US Treasury Yield Curve 9/30/93 vs.12/31/94 Shift Up 2-Yr US Treasury: 374 bps 5-Yr US Treasury: 304 bps 10-Yr US Treasury: 245 bps 12/31/94 10-Year 7.81% 2-Year 7.59% 9/30/93 10-Year 5.36% 2-Year 3.85% Yield Curve 12/31/94 Yield Curve 9/30/93 This chart is for illustrative purposes only and does not reflect the performance of any Franklin Templeton fund. Past performance does not guarantee future results. Source: Bloomberg, Federal Reserve H.15 Report.
Sector Performance Average Annual Total Returns 9/30/93 vs. 12/31/94 • Highest Performing • Floating-Rate Loans • International Bonds • High-Yield Bonds Floating-Rate Loans10.95% International Bonds 4.92% High-Yield Bonds2.71% Global Bonds1.84% Short-Term Gov’t Bonds1.69% Asset-Backed Securities 0.56% Mortgage-Backed Securities -0.58% Agencies-2.91% Municipal Bonds-3.08% • Lowest Performing • Municipal Bonds • Investment-Grade Bonds • 10-Year US Treasury Bonds Investment-Grade Corporate Bonds-3.27% 10-Year US Treasury Bonds-5.41% This chart is for illustrative purposes only and does not reflect the performance of any Franklin Templeton fund. Past performance does not guarantee future results.Treasuries, if held to maturity, offer a fixed rate of return and fixed principal value; their interest payments and principal are guaranteed. Source: Morningstar. Floating-Rate Loans are represented by Credit Suisse Leveraged Loan Index; International Bonds are represented by Citigroup World Government Bond Index Non-US; High-Yield Bonds are represented by Credit Suisse High Yield Index; Global Bonds are represented by Citigroup World Government Bond Index; Short-Term Government Bonds are represented by Barclays US Government 1–2 Year Index; Asset-Backed Securities are represented by Barclays Asset-Backed Securities Index; Mortgage-Backed Securities are represented by Barclays US MBS Index; Agencies are represented by Barclays US Agency Index; Municipal Bonds are represented by Barclays Municipal Bond Index; Investment-Grade Corporate Bonds are represented by Barclays US Corporate Investment Grade Index; 10-Year US Treasury Bondsare represented by Payden & Rygel’s 10-Year US Treasury Index. Indexes are unmanaged and one cannot invest directly in an index. Index returns do not reflect any fees, expenses or sales charges. Fed Funds Target Rate Increased 250 bps 10-Year Treasury Yield Increased 245 bps
Example 2:Big Move in Short-Term Rates Increases Fed Funds Rate: 400 bps US Treasury Yield Curve 5/31/03 vs. 6/30/06 Yield Curve from Normal to Inverted 2-Yr US Treasury: 370 bps 5-Yr US Treasury: 280 bps 10-Yr US Treasury: 154 bps 6/30/06 10-Year 5.11% 2-Year 5.12% 5/31/03 10-Year 3.57% 2-Year 1.42% Yield Curve 6/30/06 Yield Curve 5/31/03 This chart is for illustrative purposes only and does not reflect the performance of any Franklin Templeton fund. Past performance does not guarantee future results. Source: Bloomberg, Federal Reserve H.15 Report.
Sector Performance High-Yield Bonds9.69% • Highest Performing • High-Yield Bonds • Emerging Markets Debt (EMD) • Floating-Rate Loans (Average Annual Total Returns) 5/31/03 vs. 6/30/06 Emerging Markets Debt (EMD) 9.31% Floating-Rate Loans6.66% International Bonds 4.26% Global Bonds3.58% TIPS 3.31% Municipal Bonds3.00% Mortgage-Backed Securities2.87% Asset-Backed Securities 2.07% Investment-Grade Corporate Bonds1.83% • Lowest Performing • Short-Term Gov’t Bonds • Agencies • 10-Year US Treasury Bonds Short-Term Gov’t Bonds1.62% Agencies1.44% 10-Year US Treasury Bonds-0.44% This chart is for illustrative purposes only and does not reflect the performance of any Franklin Templeton fund. Past performance does not guarantee future results.Treasuries, if held to maturity, offer a fixed rate of return and fixed principal value; their interest payments and principal are guaranteed. Source: Morningstar. High-Yield Bonds are represented by Credit Suisse High Yield Index; Emerging Markets Debt are represented by J.P. Morgan Emerging Market Bond Index Global; Floating-Rate Loans are represented by Credit Suisse Leveraged Loan Index; International Bonds are represented by Citigroup World Government Bond Index Non-US; Global Bonds are represented by Citigroup World Government Bond Index; TIPS are represented by Barclays US TIPS Index; Municipal Bonds are represented by Barclays Municipal Bond Index; Mortgage-Backed Securities are represented by Barclays US MBS Index; Asset-Backed Securities are represented by Barclays-Asset Backed Securities Index; Investment-Grade Corporate Bonds are represented by Barclays US Corporate Investment Grade Index; Short-Term Government Bonds are represented by Barclays US Government 1–2 Year Index; Agencies are represented by Barclays US Agency Index; 10-Year US Treasury Bonds are represented by Payden & Rygel’s 10-Year US Treasury Index. Indexes are unmanaged and one cannot invest directly in an index. Index returns do not reflect any fees, expenses or sales charges. Fed Funds Target Rate Increased 400 bps 10-Year Treasury Yield Increased 154 bps
Income Makes a Difference Breakdown of US Bond (Barclays US Aggregate Index) PerformanceDuring Defined Rising Rate Periods Annualized Performance US Bonds – Avg. Annual Total Return US Bonds – Avg. AnnualPriceReturn US Bonds – Avg. AnnualIncomeReturn This chart is for illustrative purposes only and does not reflect the performance of any Franklin Templeton fund. Past performance does not guarantee future results. Source: Morningstar. US Bonds represented by Barclays US Aggregate Index. Indexes are unmanaged and one cannot invest directly in an index. Index returns do not reflect any fees, expenses or sales charges.
The Case for Convertibles
Convertibles: The Chameleons of the Investment World Convertible securities tend to be increasingly subject to the risks of stocks when the underlying stock price is high relative to the conversion price (because more of the security’s value resides in the conversion feature), and increasingly subject to the risks of debt securities when the underlying stock price is low relative to the conversion prices (because the conversion feature is less valuable). A convertible security is one type of security—typically a bond or a preferred stock—that can be converted into a different type of security—typically shares of that company’s common stock. Convertibles: Offer both the growth potential of stocks (via the conversion option) and the income offered by bonds (via the coupon payments) May provide better protection against erosion of value in declining markets than the underlying common stock Have an embedded conversion component that allows investors to participate in the common stock’s price appreciation If the common stock does not perform well, the bond component may provide better protection against losses than the common stock would alone
Convertibles Tend to Be Highly Correlated to Stocks and High-Yield Bonds Correlation Between Convertible Securities and Select Asset Classes 5-Year Period Ended December 31, 2018 -1 = Perfect Negative Correlation; 0 = No Correlation; +1 = Perfect Positive Correlation This chart is for illustrative purposes only and does not reflect the performance of any Franklin Templeton fund. Past performance does not guarantee future results. Treasuries, if held to maturity, offer a fixed rate of return and fixed principal value; their interest payments and principal are guaranteed. Source: Morningstar. Convertible Securities are represented by BofAML All Convertible All Qualities Index; Stocks are represented by S&P 500 Index; High-Yield Corporate Bonds are represented by Credit Suisse High Yield Index; Investment Grade Corporate Bonds are represented by Bloomberg Barclays US Corporate Investment Grade Index; and 10-Year US Treasury Bonds are represented by FTSE 10-Year US Treasury Index. Indexes are unmanaged and one cannot invest directly in an index. Index returns do not reflect any fees, expenses or sales charges.
Convertibles Have Performed Relatively Well in Past Rising Rate Periods Comparative Performance–Rising Rate PeriodsAnnualized ReturnsConvertible Securities and 10-Year US Treasury Bonds 10-Year US Treasury Bond Convertible Securities 12/31/08–4/30/10 This chart is for illustrative purposes only and does not reflect the performance of any Franklin Templeton fund. Past performance does not guarantee future results. Treasuries, if held to maturity, offer a fixed rate of return and fixed principal value; their interest payments and principal are guaranteed. Source: Morningstar. 10-Year US Treasury Bonds are represented by Payden & Rygel’s 10-Year US Treasury Index; Convertible Securities are represented by BofAML All Convertible All Qualities Index. Indexes are unmanaged and one cannot invest directly in an index. Index returns do not reflect any fees, expenses or sales charges.
What About Stocks?
Equities Have Performed Well in Past Rising Rate Environments Comparative Performance–Rising Rate PeriodsAnnualized Returns10-Year US Treasury Bonds and Stocks Stocks 10-Year US Treasury Bond 12/31/08–4/30/10 This chart is for illustrative purposes only and does not reflect the performance of any Franklin Templeton fund. Past performance does not guarantee future results. Treasuries, if held to maturity, offer a fixed rate of return and fixed principal value; their interest payments and principal are guaranteed. Sources: Morningstar, Payden & Rygel. 10-Year US Treasury Bonds are represented by the Payden & Rygel’s 10-Year US Treasury Index; Stocks are represented by the S&P 500 Index. Indexes are unmanaged and one cannot invest directly in an index. Index returns do not reflect any fees, expenses or sales charges.
An Expanding Economy Is Often Good for Stocks S&P 500 Index in Periods of Rising Rates January 1993–September 2018 07/29/16 S&P 500: 2,173.6 1/31/00 S&P 500: 1,394.46 6/30/06 S&P 500: 1,270.20 12/31/18 S&P 500: 2,506.85 9/30/98 S&P 500: 1,017.01 5/31/03 S&P 500: 963.59 1/31/14 S&P 500: 1,782.59 12/31/94 S&P 500: 459.27 9/30/93 S&P 500: 458.93 7/31/12 S&P 500: 1,379.32 Rising Rate Period S&P 500 Index Source: Morningstar. Indexes are unmanaged and one cannot invest directly in an index. Index returns do not reflect any fees, expenses or sales charges.
Revisiting Sector Performance Average Annual Total Returns This chart is for illustrative purposes only and does not reflect the performance of any Franklin Templeton fund. Past performance does not guarantee future results. Treasuries, if held to maturity, offer a fixed rate of return and fixed principal value; their interest payments and principal are guaranteed. Source: Morningstar. High-Yield Bonds are represented by Credit Suisse High Yield Index; Emerging Markets Debt are represented by J.P. Morgan Emerging Market Bond Index Global; Floating-Rate Loans are represented by Credit Suisse Leveraged Loan Index; International Bonds are represented by Citigroup World Government Bond Index Non-US; Global Bonds are represented by Citigroup World Government Bond Index; TIPS are represented by Barclays US TIPS Index; Municipal Bonds are represented by Barclays Municipal Bond Index; Mortgage-Backed Securities are represented by Barclays US MBS Index; Asset-Backed Securities are represented by Barclays Asset-Backed Securities Index; Investment-Grade Corporate Bonds are represented by Barclays US Corporate Investment Grade Index; Short-Term Government Bonds are represented by Barclays US Government 1–2 Year Index; Agencies are represented by Barclays US Agency Index; 10-Year US Treasury Bonds are represented by Payden & Rygel’s 10-Year US Treasury Index; Equities are represented by the S&P 500 Index; Convertibles are represented by the BofAML All Convertible All Qualities Index. Indexes are unmanaged and one cannot invest directly in an index. Index returns do not reflect any fees, expenses or sales charges.
S&P 500 Earnings Yield vs. 10-Year US Treasury YieldJanuary 1, 1970–December 31, 2018 US Equities May Still Be Undervalued vs. 10-Year Treasuries As of 12/31/18 This chart is for illustrative purposes only and does not reflect the performance of any Franklin Templeton fund. Past performance does not guarantee future results. Treasuries, if held to maturity, offer a fixed rate of return and fixed principal value; their interest payments and principal are guaranteed. Source: S&P, Federal Reserve. Indexes are unmanaged and one cannot invest directly in an index. Index returns do not reflect any fees, expenses or sales charges.
Equities Help Protect Purchasing Power Inflation-Adjusted Returns One Dollar Hypothetical Investment December 31,1977–December 31, 2018 $1 invested was worth: STOCKS $20.69 60% STOCKS 40% BONDS $15.34 $6.78 BONDS $1.92 GOLD $1.59 CASH EQUIV. $0.25 US DOLLAR This chart is for illustrative purposes only and does not reflect the performance of any Franklin Templeton fund. Past performance does not guarantee future results. Source: Morningstar. Stocks are represented by S&P 500 Index; Bonds are represented by Ibbotson Associates SBBI Long Term Corporate Index; Cash Equivalents are represented by the FTSE 3M Treasury Bill Index; Gold is represented byLondon Bouillon Market Association (LMBA) Gold Price PM USD; US Dollar is represented by the growth of the nominal dollar beginning in 1978, taking inflation into account. Inflation is calculated using the CPI. Indexes are unmanaged and one cannot invest directly in an index.
39 The Benefit of Diversification Risk vs. Return ComparisonS&P 500, Barclays US Aggregate Bond and Blended Portfolios30-Year Period Ended December 31, 2018 50% Stocks/ 50% Bonds Stocks 40% Stocks/ 60% Bonds 60% Stocks/ 40% Bonds Bonds This chart is for illustrative purposes only and does not reflect the performance of any Franklin Templeton fund. Diversification does not guarantee a profit or protect against a loss. Past performance does not guarantee future results. Source: Morningstar. Stocks are represented by S&P 500 Index; bonds are represented by Bloomberg Barclays US Aggregate Index. Indexes are unmanaged and one cannot invest directly in an index. Index returns do not reflect any fees, expenses or sales charges. Risk is measured by the annualized standard deviation of monthly returns.
Today’s Discussion What Drives Interest Rates? Not All Fixed Income Is Created Equal The Case for Convertibles What About Stocks? The Value of Active Management
Next Steps: Talk to your financial advisor Evaluate your current portfolio—know what you own Assess your goals and your risk tolerances—does your current portfolio have the right mix of assets to meet your investment goals? Consider reallocating from sectors with higher interest rate sensitivity to less interest rate sensitive sectors
More Information on Risks All investments involve risks, including possible loss of principal. Bond prices generally move in the opposite direction of interest rates. Thus, as the prices of bonds in a fund adjust to a rise in interest rates, the fund’s share price may decline. Changes in the financial strength of a bond issuer or ina bond's credit rating may affect the bond’s value. This communication is general in nature and intended for educational purposes only; it should not be considered tax, legal or investment advice, or an investment recommendation. Consult your financial advisor for personalized advice that is tailored to your specific goals, individual situation, and risk tolerance.
Index Descriptions Bloomberg Barclays Asset-Backed Securities Index is the component of the Barclays US Aggregate Index and includes credit and charge card, auto, and utility loans. Bloomberg Barclays Municipal Bond Index is a market-value-weighted index engineered for the long-term tax-exempt bond market. To be included in the index, bonds must be fixed rate, have at least one year to final maturity, and rated investment-grade (Baa3/BBB- or higher) by at least two of the following ratings agencies: Moody's, S&P, or Fitch. Bloomberg Barclays US Agency Index is the US Agency component of the Barclays US Government/Credit Index and includes publicly issued debt of US Government agencies, quasi-federal corporations, and corporate or foreign debt guaranteed by the US Government. Bloomberg Barclays US Aggregate Index is a market-capitalization weighted index representing the US investment grade fixed rate taxable bond market with index components for government and corporate, mortgage pass-through, and asset-backed securities. All issues included are SEC-registered, taxable, dollar denominated, non-convertible, must have at least one year to final maturity, and must be rated investment grade (Baa3/BBB-/BBB- or above) using the middle rating of Moody’s, S&P, and Fitch, respectively. Bloomberg Barclays US Corporate Investment Grade Index is the US Corporate component of the Barclays US Credit Index and covers USD-denominated, investment-grade, fixed-rate, taxable securities sold by industrial, utility, and financial institution issuers. It includes publicly issued US corporate and foreign debentures and secured notes that meet specified maturity, liquidity, and quality requirements. Bloomberg Barclays US Credit Index measures the investment grade, US dollar-denominated, fixed-rate taxable corporate and government-related bond markets. Bloomberg Barclays US Government/Credit Index is the US Government/Credit component of the Barclays US Aggregate Index and includes dollar-denominated investment grade corporate debt and non-native currency agency and local authority debt, sovereign, supranational, and taxable municipal debt, public obligations of the US Treasury with at least one year to final maturity, and publicly issued debt of US Government agencies, quasi federal corporations, and corporate or foreign debt guaranteed by the US Government. Barclays US Government/Credit Index: 1-3 Year Component is the 1-3 year component of the Barclays US Government/Credit Index and includes dollar-denominated investment grade corporate debt and non-native currency agency and local authority debt, sovereign, supranational, and taxable municipal debt, public obligations of the US Treasury with at least one year to final maturity, and publicly issued debt of US Government agencies, quasi federal corporations, and corporate or foreign debt guaranteed by the US Government. Bloomberg Barclays US Government/Credit Index: 5-10 Year Component is the 5-10 year component of the Barclays US Government/Credit Index and includes dollar-denominated investment grade corporate debt and non-native currency agency and local authority debt, sovereign, supranational, and taxable municipal debt, public obligations of the US Treasury with at least five years to final maturity, and publicly issued debt of US Government agencies, quasi federal corporations, and corporate or foreign debt guaranteed by the US Government. Bloomberg Barclays US Government Index: 1-2 Year Component is the 1-2 year component of the Barclays US Government Index.
Index Descriptions Bloomberg Barclays US Mortgage-Backed Securities (MBS) Index is the MBS component of the Barclays US Aggregate Index and covers agency mortgage-backed pass-through securities (both fixed rate and hybrid ARM) issued by Ginnie Mae (GNMA), Fannie Mae (FNMA), and Freddie Mac (FHLMC). Bloomberg Barclays Multiverse Index provides a broad-based measure of the global fixed-income bond market. The index represents the union of the Global Aggregate Index and the Global High-Yield Index and captures investment-grade and high-yield securities in all eligible currencies. Bloomberg Barclays US TIPS Index covers the universe of inflation-protected notes issued by the US Treasury that have at least one year to final maturity. BofA All Convertible All Qualities Index consists of convertible bonds traded in the US dollar denominated investment grade and non investment grade convertible securities sold into the US market and publicly traded in the United States. BofA Preferred Stock Fixed Rate Index - The Bank of America Merrill Lynch Fixed Rate Preferred Securities Index tracks the performance of fixed rate US dollar denominated preferred securities issued in the US domestic market. Citigroup 10-Year US Treasury Index is a total return index based on a constant maturity instrument. Citigroup includes both accrued interest and change in market price in its monthly total return calculations. Citigroup (3M) Treasury Bill Index is an unmanaged index that tracks short-term US government debt instruments. Citigroup Non-USD World Government Bond Index (Non-USD WGBI) is a market capitalization weighted index consisting of investment-grade world government bond markets; it includes all WGBI countries except the United States and is stated in US dollar terms. Citigroup World Government Bond Index (WGBI) is a market capitalization weighted index consisting of investment-grade world government bonds. Credit Suisse High Yield Index is designed to mirror the investible universe of the US.dollar denominated high yield debt market. Credit Suisse Leveraged Loan Index is designed to mirror the investible universe of the US dollar denominated leveraged loan market. Loans must be below investment grade and rated no higher than Baa1/BB+ or Ba1/BBB+ by Moody's and S&P. If unrated, the initial spread level must be LIBOR plus 125 basis points or higher. The tenor must be at least one year and only funded term loans are included. Ibbotson Associates SBBI US Long-Term Corporate Bond Index is designed to represent the US long-term corporate bond market. The index includes nearly all Aaa- and Aa-rated bonds.
Index Descriptions J.P. Morgan Emerging Markets Bond Index Global (EMBI Global) tracks total returns for US dollar denominated debt instruments issued by emerging market sovereign and quasi-sovereign entities: Brady bonds, loans and Eurobonds. LBMA Gold Price PM USD: The London Gold Fixing Companies set the prices for gold that are globally considered as the international standard for pricing of gold. Fixing levels are set per troy ounce. MSCI All Country (AC) World Index is a free float-adjusted, market capitalization-weighted index that is designed to measure the equity market performance of global developed and emerging markets. Payden and Rygel 10-year US Treasury Index is a total return index based on a constant maturity instrument. Payden & Rygel includes both accrued interest and change in market price in its monthly total return calculations. End of month yield levels are obtained from the Federal Reserve H15 publication and used to calculate change in price. (Data used before 2016.) S&P 500 Index is a market capitalization-weighted index of 500 stocks designed to measure total US equity market performance. Indexes are unmanaged and one cannot invest directly in an index. Index returns do not reflect any fees, expenses or sales charges.
RISING RATES WHAT YOU NEED TO KNOW RR EJ PPT 02/19