Download

1 / 10
100 likes | 237 Vues
Prioritization of Avian GO Annotation. Structural Annotation. Genome Build 2. No. Proteins (NRPD). % predicted proteins. No. Entrez Genes. Species. proteins/gene. Human. 36.3. 36,437. 415,830. 4.91. 11.41. Mouse. 37.1. 64,018. 228,696. 9.28. 3.57.

E N D
Structural Annotation Genome Build2 No. Proteins (NRPD) % predicted proteins No. Entrez Genes Species proteins/gene Human 36.3 36,437 415,830 4.91 11.41 Mouse 37.1 64,018 228,696 9.28 3.57 • The rat genome was published only 8 months prior to the chicken genome, yet rat has 2x as many genes in Entrez Gene and 3x as many proteins. • After two genome builds chicken still has 5% of genomic sequence that has not been assigned a chromosome and mini-chromosomes have not been sequenced. • Chicken genes and proteins are under-represented in public databases. • Of the chicken proteins available from NRPD, almost half are predicted based upon computational analysis. • On average chicken has only 1 protein per gene so very little is known about isoforms and alternate transcripts in the chicken gene products. Rat1 3.4 49,516 108,069 29.99 2.18 Chicken 2.1 19,9793 31,8193 46.624 1.595 NRPD: Non-redundant Protein Database
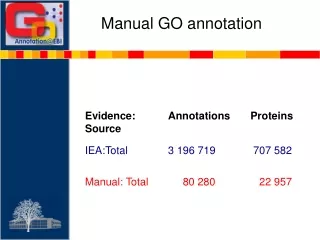
Phase 1: “Breadth” • 7, 478 Chicken entries in UniProtKB • GOA provides IEA mapping for UniProtKB entries • Initial strategy for AgBase biocurators was to add GO to chicken gene products that had none. • Since 46% of the chicken proteins in NRPD were predicted, they would have no GO • IEA, ISS, ISO….
Functional Annotation 100 80 no GO 60 % of gene products annotated computational GO AgBase 40 manual GO 20 0 Human Mouse Rat Chicken the proportion of GO for chicken is over-represented because of their under-representation in public databases
GO Annotation of Arrays • DelMar14K, FHCRC, Tgu array • 44K Agilent oligo array • AIIM array, Affymetrix • Should we be focusing on arrays? • What arrays should we do?
GO Annotation Priorities? • Provide “breadth” of coverage • Annotate products represented on arrays • Reference Genome targets • Subject areas (immunity, nutrition/metabolism, development • Ad hoc as requested