Download
1 / 38
380 likes | 517 Vues
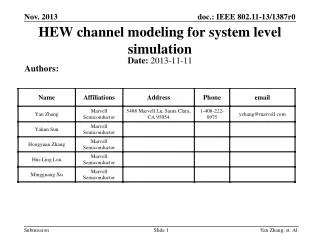
Planning Level Simulation Modeling of Channel Improvements 25-September-2007 Presented by: Keith Hofseth. Authors. Keith D. Hofseth USACE Institute for Water Resources Cory M. Rogers CDM, USA Shana Heisey Formerly of USACE Institute for Water Resources Richard M. Males

E N D
Planning Level Simulation Modeling of Channel Improvements 25-September-2007Presented by:Keith Hofseth
Authors Keith D. Hofseth USACE Institute for Water Resources Cory M. Rogers CDM, USA Shana Heisey Formerly of USACE Institute for Water Resources Richard M. Males RMM Technical Services, Inc, USA
HarborSym • Developed by the Corps of Engineers • Non-proprietary • Monte-Carlo simulation model • Geographically portable
Need for Model The Corps assists in the development of the nations ports. Evaluations of proposed port improvements where accomplished with tools and techniques developed by each port proponent. It was difficult to compare these analysis across ports. The need arose to apply the same standards and techniques to evaluate port investments to ensure equal treatment across the country.
Need for Model • Us army Corps of Engineers requires economic justification demonstrated through benefit-cost analysis. • Benefits are measured by “willingness to pay” • Willingness to pay is estimated by transportation savings due to the project
Sources of Transportation Savings • Shorter dwell time for vessels (less delay) • Loading Ships more efficiently (deeper) • Allow use of larger ships
Model Overview Network builder Network Data explorer Data entry tables
Model Overview • Data sets define study area • User interface provides access to data • Computational kernel performs simulation
Model Overview • Monte Carlo simulation model of vessel traffic for coastal harbors • Estimates transportation cost changes due to harbor improvements • Calculates vessel time in harbor • Captures inefficient delay times • Incorporates risk and uncertainty
Inputs and Outputs • Inputs • Network (reaches, docks) • Commodity transfer rates • Vessel call specifics • Vessel speeds by reach • Transit rules by reach • Outputs • Vessel times in system • Transportation costs • Rule violation statistics
Network Data Requirements • Docks • Commodity-vessel correspondence • Commodity transfer rates • Capacity, physical parameters • Aggregation possible for modeling simplicity • Reaches • Physical parameters including tidal influence • Vessel speeds • Transit restrictions • Turning Basins & Anchorages • Capacity, physical parameters
Vessel Call Data Requirements • Vessel physical parameters • Date/time vessel arrives at the port • Arrival draft • Destination dock(s) • Commodity transfer(s) at each dock
Single Vessel Rules Restrictions by dimensions Draft/ tide/ current restrictions Turning area or dock capacity Transit Rule Descriptions Multiple Vessel Rules • Passing/overtaking restrictions by: Vessel type Physical dimensions Commodities
Assistance with Data Requirements • User interface • Network builder • Vessel call import routine • Dock data import routine • Commodity data import routine • Allocator/ Statistical Analyzer • Future call list generation
Transit Rule Data Requirements • Location of application • Rules must be defined in each reach • Rule type • General description of movement restriction • Parameters of application • Reach-specific rule definition
Additional Capabilities • Tide / Current
Data Bases • Input Database (IDB) • Description of study area (docks, channels, transit rules etc.) • Vessel Call Database (VCDB) • Vessels, vessel calls, commodity transfers • Output Database (ODB) • Output results from multiple runs • Scenario Output Database (SODA) • Output results from a single run • Forecast Database (FCDB) • Commodity forecasts, fleet, constraints
Port Information Data • Port Physical Layout • Docks and Reaches • Vessel Types (RoRo, Tanker, etc.) • Classes within Type (by size ranges) • Commodity Categories • Unique Vessels • Name / Vessel Class • Physical Characteristics • Beam / LOA / Capacity / TPI • Calls • Time of Arrival / Arrival Draft • Dock Visit(s) • Commodity Transfers at Dock
Vessel Call Data Base • Unique Vessels • Vessel class • Physical characteristics • Vessel Call • Arrival Time / Draft • Route Group • Dock Visits • Commodity Transfers • Quantity / Commodity Category • Import/Export
Commodity Driven Synthetic Vessel Call List Generator • User Provides: • Commodity forecast at each dock • Dock depth limitations at each dock • Description of the available fleet • Logical constraints for commodities that can be carried by each vessel class and dock • Statistical information relating to physical characteristics of each vessel class and loading characteristics
Synthetic Vessel Call Generator – Approach • Generate synthetic fleet • Loop • Assign Portion of Commodity Forecast at Dock • to a Single Generated Vessel • Decrement Forecast at Dock and Available Fleet Until no more assignment possible • forecasts satisfied • no more available fleet • Assign arrival times to each generated call
Vessel Classificationusing data analysis tool • Import Historical using Types • Cluster analysis on capacity, beam to locate classes • Review, revise import
Future Direction • Integration of the various modules of HarborSym into a single package is currently underway. • Widening model • Deepening model • Synthetic call generation • Data analysis and visualization • Incorporation of the ability to estimate and forecast emissions from fleet operations at the harbor.
Conclusions & Summary • HarborSym has proven to be a worthwhile tool for economic analysis of proposed channel widening projects. • The visualization and data analysis tools, results viewing and animation of the simulation assist the analyst to calibrate the model and communicate results. • HarborSym allows significant transparency of the analysis appropriate for public investment decisions. • The data-driven architecture allows HarborSym to be used for many ports and improvement alternatives without significant recoding. This allow consistent analytical treatment to harbors across the country.