Download
1 / 1
10 likes | 177 Vues
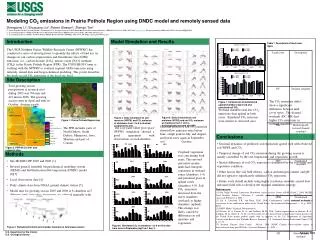
Modeling CO 2 emissions in Prairie Pothole Region using DNDC model and remotely sensed data Zhengpeng Li 1 , Shuguang Liu 2 , Robert Gleason 3 , Zhengxi Tan 1

E N D
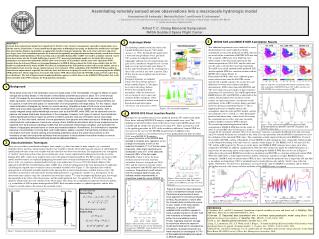
Modeling CO2 emissions in Prairie Pothole Region using DNDC model and remotely sensed data • Zhengpeng Li1, Shuguang Liu2, Robert Gleason3, Zhengxi Tan1 • Arctic Slope Research Corporation (ASRC), Contractor to U.S. Geological Survey (USGS) Earth Resources Observation and Science (EROS) Center, Sioux Falls, SD 57198, zli@usgs.gov, Work performed by ASRC under USGS contract 08HQCN0007. • U.S. Geological Survey (USGS) Earth Resources Observation and Science (EROS) Center, Sioux Falls, SD 57198, sliu@usgs.gov • U.S. Geological Survey (USGS) Northern Prairie Wildlife Research Center (NPWRC), Jamestown, ND 58401, robert_gleason@usgs.gov Introduction Model Simulation and Results Table 1. Description of land cover types The USGS Northern Prairie Wildlife Research Center (NPWRC) has conducted a series of investigations to quantify the effects of land use on changes in soil carbon sequestration and Greenhouse Gas (GHG) emissions (i.e., carbon dioxide [CO2], nitrous oxide [N2O], methane [CH4]) in the Prairie Pothole Region (PPR). The USGS EROS Center is working with the NPWRC to evaluate regional GHG emissions using remotely sensed data and biogeochemical modeling. This poster describes the work on soil CO2 emissions at the local site level. Site Description Total growing season precipitation at research sites during 2005 was 766 mm and 421 mm in 2006. The growing season starts in April and ends in October. Average yearly temperature is 15C. The CO2 emissions didn’t show a significant difference between land cover types. The drained wetlands (DC, HR) had higher CO2 emissions in wetland chambers. Figure 7. Comparison of wetland and upland chambers observed and simulated soil CO2 Wetland chambers had less CO2 emissions than upland in both years. Simulated CO2 emission were similar to observed ones. Figure 5. Daily simulation on soil moisture (WFPS) and soil CO2 emission at chambers from 1 to 8 in hydrologically restored site (HR) Figure 4. Daily simulation on soil moisture (WFPS) and CO2 emission at chambers from 1 to 8 in drained cropland site (DC) Figure 1. Prairie Pothole Region map Seasonal pattern of soil CO2 emission showed low emission rates before June, a high peak in July and August, and lower rates again in September and October. The PPR includes parts of North Dakota, South Dakota, Minnesota, Iowa, Montana and part of Canada. The soil water filled pore space (WFPS) simulation showed a good agreement with observations at each chamber. Conclusions • Seasonal dynamics of predicted soil respiration agreed well with observed soil WFPS and CO2. • Temporal change of soil CO2 emission during the growing season is mainly controlled by the soil temperature and vegetation growth. • Spatial difference of soil CO2 emission is dominated by the soil water and vegetation condition. • Other factors like soil bulk density, carbon and nitrogen content, and pH did not appear to significantly influence CO2 emissions. • Future work should include using higher resolution remotely sensed data and more field sites to develop the regional simulation strategy. 2005 2006 Figure 2. PPR NLCD 2001 and research sites Cropland vegetation was corn during both years. The restored and native prairie lands had emergent vegetation in wetland zones (chambers 1-4) and perennial grass in upland zones (chambers 5-8). Soil CO2 emissions increased from the lower chambers (wetland) to higher chambers (upland). This change was likely caused by differences in soil moisture and vegetation. Methods • Site MODIS GPP 2005 and 2006 [1] • Revised general ensemble biogeochemical modeling system (GEMS) and DeNitrification-DeComposition (DNDC) model [2][3] • Local observation data [4] • Daily climate data from NOAA ground climate station [5] • Model runs for growing season 2005 and 2006 at 8 chambers in 5 different land cover sites; parameters are adjusted manually with field observations 2005 2006 2005 2006 References [1] Oak Ridge National Laboratory Distributed Active Archive Center (ORNL DAAC), 2008, MODIS Land Products Subsets, Collection 5, available online at http://daac.ornl.gov/MODIS/modis.html. (Accessed February 11, 2009.) [2] Liu, S., Loveland, T.R., and Kurtz, R.M., 2004, Contemporary carbon dynamics in terrestrial ecosystems in the southeastern plains of the United States: Environmental Management, v. 33, p. S442–S456. [3] DNDC Model Technical Documentation, [4] Gleason, R. A. Tangen, B. A., and Laubhan, M. K., 2008, Carbon sequestration, in Gleason, R. A., Laubhan, M. K., Euliss Jr., N. H. ,eds. Ecosystem services derived from wetland conservation practices in the United States prairie pothole region with an emphasis on the U.S. Department of Agriculture Conservation Reserve and Wetlands Reserve Programs: U.S. Geological Survey Professional Paper 1745, p. 23–30. [5] National Climatic Data Center, NOAA, 2008, NNDC Climate Data:available online at http://cdo.ncdc.noaa.gov/CDO/cdo. (Accessed February 11, 2009.) 2005 2006 2005 2006 Figure 3. Wetland catchment and chamber locations in field measurement Figure 6. Simulated CO2 in chambers 1 to 8 on five sites from June to September (kgC ha-1 day-1) U.S. Department of the Interior U.S. Geological Survey February 2009