Nonlinear Interferometric Vibrational Imaging
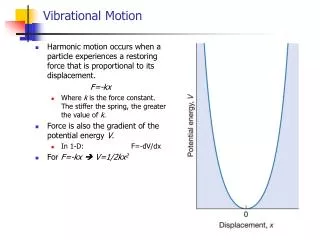
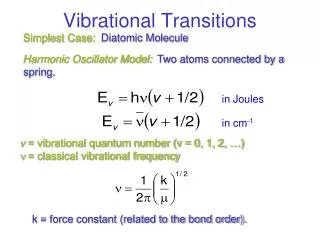
Nonlinear Interferometric Vibrational Imaging. 14. 0 = 800 nm. 12. l. 2. 2. ln(. 2. ). =. 10. o. l c. p. D. l. 8. l c (µm). BIL. BIL. 6. 4. 2. 20. 60. 100. 140. 180. 220. 260. 300. (nm). . NIVI Images. Nonlinear Interferometric Vibrational Imaging (NIVI).


Nonlinear Interferometric Vibrational Imaging
E N D
Presentation Transcript
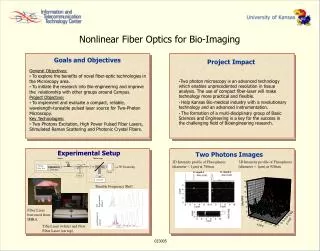
Nonlinear Interferometric Vibrational Imaging 14 0= 800 nm 12 l 2 2 ln( 2 ) = 10 o lc p D l 8 lc (µm) BIL BIL 6 4 2 20 60 100 140 180 220 260 300 (nm) NIVI Images Nonlinear Interferometric Vibrational Imaging (NIVI) Improving Optical Bandwidth & Axial Resolution Cuvette Optical Coherence Tomography Abstract While there are many diagnostic modalities that have been employed for disease detection, such as x-rays, computed tomography, ultrasound, and magnetic resonance imaging, none of these solutions combine the versatility, resolution, size, or weight to be one of the few diagnostic instruments on long-term space flights. Any such system will need to be compact, noninvasive, and be able to image a wide variety of tissues. Also, it will need to have intelligence to aid the diagnostic process because medical specialists will not always be available. Additionally, it would be desirable if such a system could also deliver treatment by altering tissue and be able to monitor the outcome of the treatment. Optical coherence tomography (OCT) is an emerging biomedical imaging technology that can perform high-resolution imaging of tissue microstructure and function. OCT is analogous to ultrasound imaging, except reflections of near-infrared light are detected rather than sound. OCT can perform "optical biopsies" of tissue, in situ, and in real-time at resolutions comparable to histopathology. Despite the integration of OCT into multiple medical and biological disciplines, imaging has relied on architectural differences within tissue, often limiting the diagnostic capability of this technology. We present the ongoing development of a new instrument that we call Non-linear Interferometric Vibrational Imaging (NIVI). NIVI integrates and extends several imaging technologies, including OCT, spectroscopic OCT imaging, and Coherent Anti-Stokes Raman Scattering (CARS) spectroscopy, to produce a versatile system capable of noninvasively measuring micron-scale structure and molecular composition of tissues. By performing nonlinear interferometric vibrational imaging of specific molecules, we intend to identify and map the presence of biomolecular precursors to cancer. Using the high-energy pulses generated with this system, we intend to perform cell and tissue ablation of pathological sites, as well as follow-up monitoring of recurrence. Interferogram between reference and sample CARS Cross-sectional image of benzene filled cuvette Axial resolution in OCT depends inversely on spectral bandwidth Reference Mirror l Molecular Species Coherent CARS beam is generated in both reference and sample arm and used to generate a molecule-specific image lc = Coherence length o = Center wavelength = Bandwidth (FWHM) Sample Tunable Sources BS Assumptions: Gaussian spectrum, non-dispersive medium 2mm 1mm Resolution Axial: ~200 m Transverse: ~20 m Detector 2 2 • Non-linear Interferometry Provides: • In vivo imaging capabilities • Heterodyne Sensitivity • Phase Resolution • Coherence Gating • Molecular referencing • Multiplexed CARS – detection of full molecules En face images of benzene filled cuvette Spectral Broadening in ultra-high numerical aperture (UHNA) Fiber lc Cuvette Stokes present Stokes blocked z z 140 nm 40 nm lc 2 m Arbitrary Units lc 7 m Pump: Titanium:sapphire, (810 ± 20) nm, 500 mW avg power, lc 7 m Output: UHNA fiber, (780 ± 70) nm, 100 mW avg power, lc 2 m Optical Ranging in Biological Tissue lc >> m lc < m Short Coherence Length Long Coherence Length Low-Coherence Interferometry. OCT performs optical ranging in biological tissues. Low-coherence interferometry using a Michelson-type interferometer is a means by which the precise location of a reflection can be determined. An optical source such as a superluminescent diode or a mode-locked laser is used to produce low-coherence light. Reference Arm m 1mm 600 800 900 1000 700 Wavelength (nm) BS Sample Arm Source Detector Spectroscopic Optical Coherence Tomography Mach-Zehnder Beam Geometry Laser System Schematic Milestones Moving FFT DPSS New Proposed High Signal Efficiency- Mach-Zehnder Setup DPSS 90T/10R Beamsplitter z Mirrors • Construct a unique laser system capable of high-resolution OCT, spectroscopic OCT, and coherent anti-Stokes Raman scattering (CARS) spectroscopy. • Improve OCT imaging resolution by generating supercontinuum light in pumped optical fibers. • Develop spectroscopic OCT techniques to identify variations in scattering and absorption. • Perform morphological and spectroscopic OCT imaging of in vitro tumors. Stretcher/ Compressor High quality IR achromatic microscope objective Carrier Spectrum: Spectroscopic OCT Spectral Reflection / Scattering Absorption Corner Cube Envelope: Amplitude OCT Reflectivity / Scattering Dichroic beamsplitter Ti:Saph Object on 3-D Translator Dichroic beamsplitter 50/50 beamsplitter Object Probe Spectroscopic OCT extracts the spectral information content from the interferogram fringes along each axial scan. A moving windowed Fourier or Morlet Wavelet transform can be used to obtain the spectrum of the light being reflected at each interface. An in vivo demonstration of this technique is shown to the left. This image was taken of a Xenopus leavis (African Frog) tadpole. Pump: 800 nm J Regen. Amp. OPA Dispersion compensation Stokes: 850-2300 nm Photodetector 1 Pump Path delay compensation Spatial filter Structural OCT (Tadpole) Spectroscopic OCT (Centroid color code) Reference Sample Photodetector 2 A combination of lasers is needed to generate high-energy pulses to perform OCT, induce nonlinear effects for CARS, and to ablate cells and tissue. A diode-pumped solid state laser (DPSS) is used to pump a titanium:sapphire oscillator which in-turn seeds a regenerative amplifier. Ultra-short pulses (50-100 fs) are amplified to hundreds of nanojoules. Output from the regen is split. These high-energy pulses can be used to ablate cells. Half of the regen output is sent through a stretcher-compressor and to an optical parametric amplifier (OPA). This system is tunable over the range of 850-2300 nm. The two beams are re-combined and sent to a free-space interferometer for Nonlinear Interferometric Vibrational Imaging (NIVI). Spatial filter 50/50 beamsplitter (can be a cube) Anti-stokes absorption filters Spatial filter is a lens/pinhole combination Path delay compensation and dither Spectroscopic OCT (Normalized to laser centroid) Spectroscopic OCT (Normalized and noise thresholded) CCD Image of interference pattern Daniel Marks1, Selezion Hambir2, Claudio Vinegoni1, Jeremy Bredfeldt1, Chenyang Xu1, Jian Ye1 Amy Wiedemann3, Dana Dlott2, Martin Gruebele2, Barbara Kitchell3, Stephen A. Boppart4 1Department of Electrical and Computer Engineering; 2Department of Chemistry; 3Department of Veterinary Oncology; 4Department of Electrical and Computer Engineering, Bioengineering, College of Medicine University of Illinois at Urbana-Champaign • Summary • Novel OCT and nonlinear optical techniques have the potential for generating morphological, cellular, and molecular images of tissues. • OCT resolution has been improved by using supercontinuum light generated in ultra-high numerical aperture fibers. • Spectroscopic OCT can determine local absorption and/or scattering changes within samples. • Nonlinear Interferometric Vibrational Imaging (NIVI) has been used to generate images based on molecular composition. • Upcoming Milestones • Correlate high-resolution and spectroscopic OCT data with cellular features in tumor specimens. • Demonstrate Nonlinear Interferometric Vibrational Imaging in material samples and biological specimens. • Investigate morphological, spectroscopic, and molecular changes in tumor tissues following laser ablation using OCT techniques. Coherent anti-Stokes Raman Scattering (CARS) Measurement of CARS Interference • Non-linear method for detecting molecular bond resonances in the mid- to far-infrared using near-infrared light • Pump and Stokes beams are overlapped and tightly focused in a (3) medium, CARS signal is emitted CCD Camera Parameters Pump: 800nm 80mW Stokes: 1056nm 5mW CARS: 655nm ~mW Species: Benzene p = pump laser frequency Virtual State Virtual State s = Stokes laser frequency Sample pump Stokes pump CARS AS = anti-Stokes output frequency Vibration State 1 Reference Pump 0 Ground State CARS= 2pump- Stokes Stokes Tune frequency difference (p - s) to match molecular vibrational levels (|1> and |0>) 50/50 Beam-splitter CARS Spectroscopy of Tumor Cell Populations We have produced the first demonstration of mutually interfered, independently generated CARS signals in non-gaseous media. Phase coherence is indeed preserved (and is stable) between two separately generated CARS signals, despite the potential of self-focusing, self-phase-modulation, and other undesirable nonlinear effects. Feline Fibrosarcoma, 25000 cells/l Canine Fibrosarcoma, 55000 cells/l C H Cross-section of interference pattern Pump = 527 nm, Stokes = 628.4 nm, Shift 3060 cm-1 • CARS field is coherent: deterministically related to pump and Stokes • Interference occurs between two coherent anti-Stokes signals generated from • the same pump/Stokes beams! Biophotonics Imaging Laboratory Website: http://nb.beckman.uiuc.edu/biophotonics This work was supported by NASA and the National Institutes of Health (NCI)