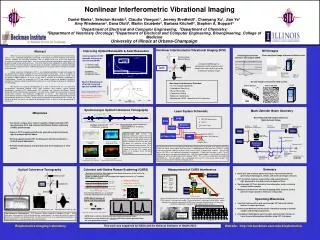
Virtual Source Imaging vs. Interferometric Imaging by Gerard T. Schuster, Andrey Bakulin, and Rodney Calvert
This article outlines the theory, data, illustration, and summary of virtual source imaging versus interferometric imaging. It discusses concepts such as Green's function, redatumed data, secondary sources along the well, VSP ghost, CDP reflection, readtuming, and interferometry.

Virtual Source Imaging vs. Interferometric Imaging by Gerard T. Schuster, Andrey Bakulin, and Rodney Calvert
E N D
Presentation Transcript
Virtual Source Imaging vs Interferometric Imaging Gerard T. Schuster, Andrey Bakulin and Rodney Calvert
Outline Theory Data Illustration Summary
u = Dg g D*u D(s’|s) W ,s U(g’|s) = G(g’|s’) D(s’|s)ds’ -1 u =[D*D] D*g Greens Function for s & g in well Redatumed data for s & g in well (g,M,s)= d(g|s) d(M|s)* s G(g’|s’) ~ U(g’|s)D(s’|s)*ds s Greens Thm: Every pt along well acts as a secondary source D(s’|s) U(g’|s’) s’ g’
Outline Theory Data Illustration Summary
G(g’|s’) G(g’|s’) ~ U(g’|s)D(s’|s)*ds Depth (ft) 30 900 0 Raw Data(CRG15) D(s’|s) Time (s) U(g’|s) 0.3
Outline Theory Data Illustration Summary
U(g’|s) = G(g’|s’) D(s’|s)ds’ -1 g =[D*D] D*u VSP Ghost VSP Direct 1. u = Dg CDP Refl. G(g’|s’) 2. -1 -1 ~ 1/D ~ 1/W [D*D] [D*D] Virtual Source Readtuming Interferometry Redatuming Summary