Download
1 / 12
120 likes | 347 Vues
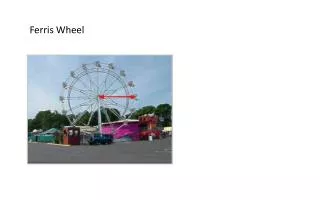
Ferris Wheel Physics. Brought to you by: Feith Fischborn Kacey Kesselhuth Lindee League Stephanie Sawyer. Our Hypothesis. At the bottom of the Ferris wheel, apparent weight is more than normal weight At the top of the Ferris wheel, apparent weight is less than normal weight

E N D
Ferris Wheel Physics Brought to you by: Feith Fischborn Kacey Kesselhuth Lindee League Stephanie Sawyer
Our Hypothesis • At the bottom of the Ferris wheel, apparent weight is more than normal weight • At the top of the Ferris wheel, apparent weight is less than normal weight • At the far left and far right sides, apparent weight is simply mgwhich is normal
Equipment • One large Ferris Wheel • One force plate • One PDA (connected to force plate) • One person (of a pre-measured weight) to sit on force plate • One person to run PDA equipment • Two people to communicate with Ferris Wheel operators and to call Prof Winslow regarding difficulties with PDA • Tape Measurer • Video Recorder
Procedure • Proceed to Ferris Wheel and enter little gondola • Set up the force plate and PDA • Sit on force plate while keeping feet off the ground (one person only) • Start collecting data when Ferris Wheel reaches constant velocity • Enjoy the ride
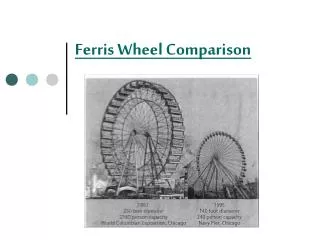
More Procedure In order to determine the radius of the Ferris Wheel… • Videotape the ride from a distance • Measure a reference point that is close to the Ferris Wheel base • Put video and information into VideoPoint software to determine the radius
calculations • To determine Fn at the sides, mass was multiplied by gravity mg=(51.5kg)(9.8m/s2)=505N • Fn=mv2/r+mg was used to calculate Fn at the top and bottom Fnbottom=(51.5kg)(5.04m/s)2/22.5m+(51.5kg)(9.8m/s2)=562.8N Fntop=-(51.5kg)(5.04m/s)2/22.5m+ (51.5kg) (9.8m/s2) =446.9N
From the graphs… • Fn at the sides equals mg=505N • Fn at the bottom equals 420N (a difference of approximately 26.9N) • Fn at the top equals 590N (a difference of approximately 27.2N)
X Position vs. Time This graph shows the movement of the ride- starts low, goes high, then low, then high- around in a circle A: Vx=0 B: Vx= negative C: Vx=0 D: Vx= positive A Slope=velocity B D C
compare B A B A D C C D
Force Plate Graph As evident from the graph, Fn changes as the little gondolas rotate Fn changes because it is directly related to velocity Velocity (in the x direction) is zero at the far sides, negative at the top, and positive at the bottom D A C B
At the sides, the centripetal acceleration is perpendicular to the normal force and, therefore, does not affect it The Fn values at the top and bottom are different because at the top, centripetal acceleration is negative and at the bottom, the centripetal acceleration is positive The results make sense because…(conclusions)