Download
1 / 19
190 likes | 354 Vues
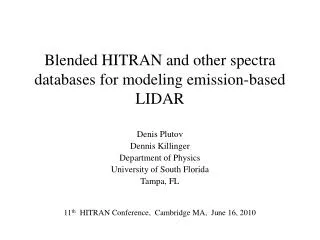
Blended HITRAN and other spectra databases for modeling emission-based LIDAR. Denis Plutov Dennis Killinger Department of Physics University of South Florida Tampa, FL. 11 th HITRAN Conference, Cambridge MA, June 16, 2010. Outline. Emission based LIDAR

E N D
Blended HITRAN and other spectra databases for modeling emission-based LIDAR Denis Plutov Dennis Killinger Department of Physics University of South Florida Tampa, FL 11th HITRAN Conference, Cambridge MA, June 16, 2010
Outline • Emission based LIDAR - LIBS (Laser-induced breakdown spectroscopy) - LITE (Laser-induced thermal emission) - Modification of LIDAR detected spectrum by atmosphere • Use of HITRAN-PC and LIDAR-PC for LIBS / LITE modeling • Blended databases for modeling - Comparison of HITRAN and GEISA - Comparison of PNNL, EPA, HITRAN, and GEISA • Current work - Need for embedded web-browser to access web-based databases (Mpi-Mainz, JPL, CDMS, EPA) - New spectral features planned for HITRAN-PC 5.0 Beta - Real time spectral decomposition approach examples 5. Overall Philosophy of HITRAN-PC as a Spectral Design Tool
Emission based LIDAR setups LIBS setup LITE setup
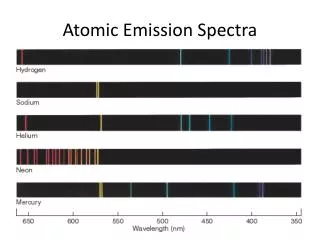
Example of atmospheric effects on experimental LITE spectra Experimental LITE spectrum of painted wood Atmospheric path ~1 meter
Importance of blended databases for accurate transmission spectra • Modify our existing HITRAN-PC to include - UV-VIS databases (important for UV LIBS etc.) - IR experimental databases (atmospheric pollutants etc) • Combined use / blending and comparison of databases - Addition of contaminant clouds to the atmosphere - Supplementing spectral data unavailable in HITRAN (such as O2 absorption in the UV for LIBS etc.)
Blended / new databases supported by HITRAN-PC 5.0 Beta • GEISA line-by-line • GEISA cross-sections (difficult to use with automated access) • New experimental databases supported - AEDC / EPA (Atmospheric pollutants) - Coblentz IR database - NIST IR databases - Mpi-Mainz UV-VIS spectral atlas • JPL and CDMS
Running HITRAN-PC with HITRAN and GEISA at the same time and same parameters HITRAN GEISA Calculation parameters: Slant path 45 degree up looking, 20 km path, 20 layers, US standard
Example: HITRAN and GEISA line-by-line comparisons for CH4 HITRAN HITRAN GEISA GEISA Calculation parameters: 1000m path, part. press: 5E-4 Atm
Example: Comparison of the PNNL, EPA, HITRAN and GEISA line-by-line for CH3Br PNNL HITRAN GEISA EPA* * - EPA (Multi-spectra, some with contaminants) CH3Br , 1 km path, 5ppm
Example: Comparison of the PNNL, EPA, HITRAN and GEISA line-by-line for CH3Cl PNNL HITRAN GEISA EPA* CH3Cl , 1 km path, 5ppm * - EPA (Multi-spectra, some with contaminants)
Web-browser database access approachfrom within HITRAN-PC • May need to use embedded Web browser for some databases with manual record-by-record access • (Need to interface and work with database owners) • Databases: • MPI-Mainz UV-VIS Spectral Atlas • JPL • CDMS • AEDC / EPA
New spectral features Planned for Beta 5.0 • Store individual line spectra for each line-by-line record (and for each layer) • Easy to assemble / merge lines or isotopes separately or as a composite in real time with no recalculation • Easy direct comparison of different databases in number of lines, differences in coverage etc. • New lineshapes and models
Real time spectra decomposition Composite Molecule totals Isotope totals Separate molecule lines Separate isotope lines Calculation parameters: HITRAN database, US Standard (H2O and CO2), horizontal 1000 m path
PNNL and HITRAN comparison for CO2 with spectral decomposition Green – Hitran line-by-line, Blue - PNNL Calculation parameters: US Standard, 100m, CO2