4.1 What Is a Function?
4.1 What Is a Function?. Section 4.1 p 1.

4.1 What Is a Function?
E N D
Presentation Transcript
4.1 What Is a Function? Section 4.1 p1
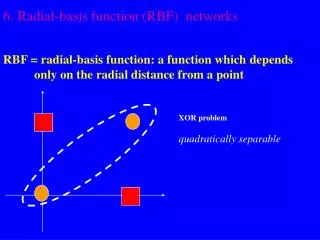
In everyday language, function expresses the notion of one thing depending on another. We might say that election results are a function of campaign spending, or that ice cream sales are a function of the weather. In mathematics, the meaning of function is more precise, but the idea is the same. If the value of one quantity determines the value of another, we say the second quantity is a function of the first. A function is a rule that takes numbers as inputs and assigns to each input exactly one number as output. The output is a function of the input. Section 4.1 p2
A 20% tip on a meal is a function of the cost, in dollars, of the meal. What is the input and what is the output to this function? Example 1 Solution The input is the amount of the bill in dollars, and the output is the amount of the tip in dollars. Section 4.1 p3
Function Notation We use function notation to represent the output of a function in terms of its input. The expression f(20), for example, stands for the output of the function f when the input is 20. Here the letter f stands for the function itself, not for a number. If f is the function in Example 1, we have f(20) = 4, since the tip for a $20 meal is (0.2)(20) = $4. In words, we say “f of 20 equals 4.” In general, f(Amount of bill) = Tip. Section 4.1 p4
For the function in Example 1, let B stand for the bill in dollars and T stand for the tip in dollars. (a) Express the function in terms of B and T . Example 2 Solution (a) Since the tip is 20% of B, or 0.2B, we have T = f(B) = 0.2B. This tells us the tip on a $8.95 meal is $1.79, and the tip on a $23.70 meal is $4.74. Function Notation (continued) (b) Evaluate f(8.95) and f(23.70) and interpret your answer in practical terms. (b) We have f(8.95) = 0.2(8.95) = 1.79 and f(23.70) = 0.2(23.70) = 4.74. Section 4.1 p5
If you buy first-class stamps, the total cost in dollars is a function of the number of stamps bought. (a) What is the input and what is the output of this function? Example 3 Solution (a) The input is the number of stamps, and the output is the total cost: Total cost = f(Number of stamps). (c) Since 44 cents is 0.44 dollars, n stamps cost 0.44n dollars, so C = f(n) = 0.44n. Function Notation(continued) (b) Use function notation to express the fact that the cost of 14 stamps is $6.16. (c) If a first-class stamp costs 44 cents, find a formula for the cost, C, in dollars, in terms of the number of stamps, n. (b) If the total cost is $6.16 for 14 stamps, then f(14) = 6.16. Section 4.1 p6
Function Notation(continued) Dependent and Independent Variables A variable used to stand for the input, such as B in Example 2 or n in Example 3, is also called the independent variable, and a variable used to stand for the output, such as T in Example 2 or C in Example 3, is also called the dependent variable. Symbolically, Output = f(Input) Dependent = f(Independent). Section 4.1 p7
Function Notation(continued) Dependent and Independent Variables The cost in dollars of tuition, T , at most colleges is a function of the number of credits taken, c. Express the relationship in function notation and identify the independent and dependent variables. Example 4 Solution We have Tuition cost = f(Number of credits), or T = f(c). The independent variable is c, and the dependent variable is T . Section 4.1 p8
Function Notation(continued) The area of a circle of radius r is given by A = πr2. What is the independent variable? What is the dependent variable? Example 5 Solution We use this function to compute the area when we know the radius. Thus, the independent variable is r, the radius, and the dependent variable is A, the area. Dependent and Independent Variables In a situation like Example 5, where we have a formula like A = πr2 for the function, we often do not bother with function notation. Section 4.1 p9
Example 6 If evaluate each of the following (a) f(0) (b) f(16) (c) f(122). Solution (a) We have (b) We have (c) We have Function Notation(continued) Evaluating Functions If f(x) is given by an algebraic expression in x, then finding the value of f(5), for instance, is the same as evaluating the expression at x = 5. Example 6 (c) illustrates that the input to a function can be more complicated than a simple number. Often we want to consider inputs to functions that are numerical or algebraic expressions. Section 4.1 p10
Function Notation(continued) Solution Example 7 To evaluate a function at an expression, such as a −2, it is helpful to remember that a −2 is the input, and to rewrite the formula for f as Output = h(Input) = (Input)2 − 3 · (Input) + 5. (a) First input a, then subtract 2: (b) In this case, Input = a − 2. We substitute and multiply out: h(a − 2) = (a − 2)2 − 3(a − 2) + 5 = a2 − 4a + 4 − 3a + 6 + 5 = a2 − 7a + 15. (solution continued on next slide) Let h(x) = x2 − 3x + 5. Evaluate the following (a) h(a) − 2 (b) h(a − 2) (c) h(a − 2) − h(a). Evaluating Functions (continued) Section 4.1 p11
Function Notation(continued) Example 7 (continued) Let h(x) = x2 − 3x + 5. Evaluate the following (c) h(a − 2) − h(a). Evaluating Functions (continued) Solution (continued) (continued from previous slide) To evaluate a function at an expression, such as a − 2, it is helpful to remember that a − 2 is the input, and to rewrite the formula for f as Output = h(Input) = (Input)2 − 3 · (Input) + 5. (c) We must evaluate h at two different inputs, a − 2 and a. We have Section 4.1 p12
Function Notation(continued) Example 8 Let n = f(p) be the average number of days a house in a particular community stays on the market before being sold for price p (in $1000s), and let p0 be the average sale price of houses in the community. What do the following expressions mean in terms of the housing market? (a) f(250) (b) f(p0 + 10) (c) f(0.9p0) Evaluating Functions (continued) Solution (a) This is the average number of days a house stays on the market before being sold for $250,000. (b) Since p0 + 10 is 10 more than p0 (in thousands of dollars), f(p0 + 10) is the average number of days a house stays on the market before being sold for $10,000 above the average sale price. (c) Since 0.9p0 is 90% of p0, or 10% less than p0, f(0.9p0) is the average number of days a house stays on the market before being sold at 10% below the average sale price. Section 4.1 p13
Function Notation(continued) Example 9a • Let f(A) be the number of gallons needed to paint a house with walls of area A ft2. • In the statement f(3500) = 10, what are the units of the 3500 and the 10? What does the statement tell you about painting the house? • (Example 9bc continued on next slide.) Solution 9a (a) The input, 3500, is the area of the walls, so its units are ft2. The output, 10, is the number of gallons of paint. The statement f(3500) = 10 tells us that we need 10 gallons to paint 3500 ft2 of wall. (Solution 9bc continued on next slide.) Evaluating Functions (continued) When interpreting the meaning of a statement about functions, it is often useful to think about the units of measurement for the independent and dependent variables. Section 4.1 p14
Function Notation(continued) Example 9bc Evaluating Functions (continued) (Example and Solution 9bc continued from previous slide.) Let f(A) be the number of gallons needed to paint a house with walls of area A ft2. (b) Suppose f(A) = A/350. How many gallons do you need to paint a house whose walls measure 5000 ft2? 10,000 ft2? (c) Explain in words the relationship between the number of gallons and A. What is the practical interpretation of the 350 in the expression for the function? Solution (b) For walls measuring 5000 ft2 we need f(5000) = 5000/350 = 14.3 gallons. For walls measuring 10,000 ft2 we need f(10,000) = 10,000/350 ≈ 28.6 gallons. (c) The expression tells us to divide the area by 350 to compute the number of gallons. This means that 350 ft2 is the area covered by one gallon. Section 4.1 p15
Table 4.1Values of g(a) = a2 Figure 4.1: Graph of values of g(a) = a Tables and Graphs We can often see key features of a function by making a table of output values and by drawing a graph of the function. For example, Table 4.1 and Figure 4.1 show values of g(a) = a2 for a = −2,−1, 0, 1 and 2. We can see that the output values never seem to be negative, which is confirmed by the fact that a square is always positive or zero. Section 4.1 p16
Figure 4.2: More values of g(a) = a2 Figure 4.3: Graph of g(a) = a2 Tables and Graphs (continued) If we plot more values, we get Figure 4.2. Notice how the points appear to be joined by a smooth curve. If we could plot all the values we would get the curve in Figure 4.3. This is the graphof the function. A graphing calculator or computer shows a good approximation of the graph by plotting many points on the screen. Section 4.1 p17
Solution Example 10 Explain how Table 4.1 and Figure 4.3 illustrate that g(a) = g(−a) for any number a. Notice the pattern in the right column of Table 4.1: the values go from 4 to 1 to 0, then back to 1 and 4 again. This is because (−2)2 and 22 both have the same value, namely 4, so g(−2) = g(2) = 4. Similarly, g(−1) = g(1) = 1. We can see the same thing in the symmetrical arrangement of the points in Figures 4.1 and 4.2 about the vertical axis. Since both a2 and (−a)2 have the same value, the point above a on the horizontal axis has the same height as the point above −a. Tables and Graphs (continued) Section 4.1 p18
Example 11 For the function graphed in Figure 4.4, find f(x) for x = −3, −2, −1, 0, 1, 2, 3. Figure 4.4 Solution The coordinates of a point on the graph of f are (a, f(a)) for some number a. So, since the point (−3, 0) is on the graph, we must have f(−3) = 0. Similarly, since the point (−2, 2) is on the graph, we must have f(−2) = 2. Using the other marked points, we get the values in Table 4.2. Table 4.2 Tables and Graphs (continued) Section 4.1 p19
4.1 WHAT IS A FUNCTION? Key Points • Function notation • Independent and dependent variables • Evaluating functions • Using units to interpret functions • Representing functions using tables and graphs Section 4.1 p20
4.2Functions and Expressions Section 4.2 p21
A function is often defined by an expression. We find the output by evaluating the expression at the input. By paying attention to the form of the expression, we can learn properties of the function. Section 4.2 p22
Bernardo plans to travel 400 miles over spring break to visit his family. He can choose to fly, drive, take the train, or make the journey as a bicycle road trip. If his average speed is r miles per hour, then the time taken is a function of r and is given by • Time taken at r miles per hour = T(r) = 400/r. • Find T(200) and T(80) and give a practical interpretation of the answers. • (See next slide for Example 1b.) Example 1a Solution (a) We have T(200) = 400/200 = 2 and T(80) = 400/80 = 5. This means that it takes Bernardo 2 hours traveling at 200 miles per hour and 5 hours traveling at 80 miles per hour. Using Expressions to Interpret Functions Section 4.2 p23
Bernardo plans to travel 400 miles over spring break to visit his family. He can choose to fly, drive, take the train, or make the journey as a bicycle road trip. If his average speed is r miles per hour, then the time taken is a function of r and is given by Time taken at r miles per hour = T (r) = 400/r. (b) Use the algebraic form of the expression for T (r) to explain why T (200) < T (80), and explain why the inequality makes sense in practical terms. Example 1b Solution (b) In the fraction 400/r, the variable r occurs in the denominator. Since dividing by a larger number gives a smaller number, making r larger makes T(r) smaller. This makes sense in practical terms, because if you travel at a faster speed you finish the journey in less time. Using Expressions to Interpret Functions (continued) Section 4.2 p24
Example 2a • For the function T(r) in Example 1, • Make a table of values for r = 25, 80, 100, and 200, and graph the function. • (See next slide for Example 2b.) Solution • Table 4.4 shows values of the function, and Figure 4.5 shows the graph. • Table 4.4 • Values of • T(r) = 400/r • Figure 4.5: Graph of 400/r Using Expressions to Interpret Functions (continued) It is also useful to interpret the algebraic form graphically. Section 4.2 p25
Solution Example 2b Figure 4.5: Graph of 400/r (b) The graph slopes downward as you move from left to right. This is because the points to the right on the graph correspond to larger values of the input, and so to smaller values of the output. Since the output is read on the vertical axis, as one moves to the right on the horizontal axis, output values become smaller on the vertical axis. For the function T(r) in Example 1, (b) Explain the shape of the graph using the form of the expression 400/r. Using Expressions to Interpret Functions (continued) Section 4.2 p26
Using Expressions to Interpret Functions (continued) Example 3 Einstein’s famous equation E = mc2 expresses energy E as a function of mass m. Which letters in this equation represent variables and which represent constants? Solution We are given that E is a function of m, so E is the dependent variable and m is the independent variable. The symbol c is a constant (which stands for the speed of light). Constants and Variables Sometimes an expression for a function contains letters in addition to the independent variable. We call these letters constants because for a given function, their value does not change. Section 4.2 p27
Using Expressions to Interpret Functions (continued) • A tip of r percent on a bill of B dollars is given in dollars by • Which letters in the expression (r/100)B would you call variables and which would you call constants if you were considering • The tip as a function of the bill amount? • (See next slide for Example 4b.) Example 4a Solution (a) In this situation, we regard the tip as a function of the variable B and regard r as a constant. If we call this function f, then we can write Constants and Variables (continued) Which letters in an expression are constants and which are variables depends on the context in which the expression is being used. Section 4.2 p28
Using Expressions to Interpret Functions (continued) A tip of r percent on a bill of B dollars is given in dollars by Which letters in the expression (r/100)B would you call variables and which would you call constants if you were considering (b) The tip as a function of the rate? Example 4b Solution (b) Here we regard the tip as a function of the variable r and regard B as a constant. If we call this function g, then Constants and Variables (continued) Section 4.2 p29
Functions and Equivalent Expressions A number can be expressed in many different ways. For example, 1/4 and 0.25 are two different ways of expressing the same number. Similarly, we can have more than one expression for the same function. Section 4.2 p30
Example 5a • In Example 2 we found the expression 0.2B for a 20% tip on a bill. Pares says she has an easy way to figure out the tip: she moves the decimal point in the bill one place to the left then doubles the answer. • Check that Pares’ method gives the same answer on bill amounts of $8.95 and $23.70 as Example 2. • (See next slide for Example 5b.) Solution (a) For $8.95, first we move the decimal point to the left to get 0.895, then double to get a tip of $1.79. For $23.70, we move the decimal point to the left to get 2.370, then double to get a tip of $4.74. Both answers are the same as in Example 2. Functions and Equivalent Expressions (continued) Section 4.2 p31
In Example 2 we found the expression 0.2B for a 20% tip on a bill. Pares says she has an easy way to figure out the tip: she moves the decimal point in the bill one place to the left then doubles the answer. (b) Does Pares’ method always work? Explain your answer using algebraic expressions. Example 5b Solution (b) Moving the decimal point to the left is the same as multiplying by 0.1. So first Pares multiplies the bill by 0.1, then multiplies the result by 2. Her calculation of the tip is 2(0.1B). We can simplify this expression by regrouping the multiplications: 2(0.1B) = (2 · 0.1)B = 0.2B. This last expression for the tip is the same one we found in Example 2. Functions and Equivalent Expressions (continued) For each value of B the two expressions, 2(0.1B) and 0.2B, give equal values for the tip. Although the expressions appear different, they are equivalent, and therefore define the same function. Section 4.2 p32
Let g(a) = a2 − a. Which of the following pairs of expressions are equivalent? (a) g(2a) and 2g(a) (See next slide for Example 6bc.) Example 6a Solution (a) In order to find the output for g, we square the input value, a and subtract a from the square. This means that g(2a) = (2a)2 − (2a) = 4a2 − 2a. The value of 2g(a) is two times the value of g(a). So 2g(a) = 2(a2 − a) = 2a2 − 2a. The two expressions are not equivalent. Functions and Equivalent Expressions (continued) Section 4.2 p33
Let g(a) = a2 − a. Which of the following pairs of expressions are equivalent? (b) (1/2)g(a) and g(a)/2 (c) g(a + 1) and g(a) + 1 Example 6bc Solution (b) Since multiplying by 1/2 is the same as dividing by 2, the two expressions are equivalent: (c) To evaluate g(a + 1) we have g(a + 1) = (a + 1)2 − (a + 1) = a2 + 2a + 1 − a − 1 = a2 + a. To evaluate g(a) + 1 we add one to g(a), so g(a) + 1 = a2 − a + 1. The two expressions are not equivalent. Functions and Equivalent Expressions (continued) Section 4.2 p34
Example 7 Express each of the following functions in the form Q = kt and give the value of k. (a) Q = 5t + rt (b) Q = −t/10 (c) Q = t(t + 1) − t(t − 1) Functions and Equivalent Expressions (continued) Often we need to express a function in a standard form to recognize what type of function it is. Solution (a) We have Q = 5t + rt = (5 + r)t, which is the form Q = kt, with k = 5 + r. (b) Rewriting the fraction as Q = −t/10 =(−1/10)t = −0.1t, we see that k = −0.1. (c) We have Q = t(t + 1) − t(t − 1) = t2 + t − t2 + t = 2t, so k = 2. Section 4.2 p35
4.2 FUNCTIONS AND EXPRESSIONS Key Points • Understanding a function’s behavior from its form • Constants and variables • Equivalent expressions define the same function Section 4.2 p36
4.3Functions and Equations Section 4.3 p37
Example 1a • In Example 1 in Section 4.2 we saw that the function T(r) = 400/r • gives the time taken for Bernardo to travel 400 miles at an average speed of r miles per hour. • Write an equation whose solution is the average speed Bernardo would have to maintain to make the trip in 10 hours. • (See next slide for Example 1b.) Solution • We want the time taken to be 10 hours, so we want T(r) = 10. Since T(r) = 400/r, we want to solve the equation Using Equations to Find Inputs from Outputs Sometimes we want to find the inputs that give a certain output. To do that, we must solve an equation. For example, if f(x) = x2, and we want to know what inputs to f give the output f(x) = 16, we must solve the equation x2 = 16. The solutions x = 4 and x = −4 are the inputs to f that give 16 as an output. Section 4.3 p38
Example 1b In Example 1 in Section 4.2 we saw that the function T(r) = 400/r gives the time taken for Bernardo to travel 400 miles at an average speed of r miles per hour. (b) Solve the equation and represent your solution on a graph. Solution (b) Multiplying both sides by r we get: 10r = 400, r = 400/10 = 40, so we see that the solution is r = 40. In function notation, T(40) = 10. See Figure 4.6. We also know the shape of the graph from Figure 4.5, Section 4.2, Example 2. Figure 4.6: Solution to 400/r = 10 is r = 40 Using Equations to Find Inputs from Outputs (continued) Section 4.3 p39
Reading Solutions from the Graph Example 2a • A town’s population t years after it was incorporated is given by the function f(t) = 30,000 + 2000t. • Make a table of values for the population at five-year intervals over a 20-year period starting at t = 0. Plot the results on a graph. Solution (a) The initial population in year t = 0 is given by f(0) = 30,000 + 2000(0) = 30,000. In year t = 5 the population is given by f(5) = 30,000 + 2000(5) = 30,000 + 10,000 = 40,000. In year t = 10 the population is given by f(10) = 30,000 + 2000(10) = 30,000 + 20,000 = 50,000. Similar calculations for year t = 15 and year t = 20 give the values in Table 4.5 and Figure 4.7. (See next slide for Table 4.5 and Figure 4.7.) In Example 1 we visualized the solution on a graph. Sometimes it is possible to see the solution directly from a table or a graph. Section 4.3 p40
Example 2ab A town’s population t years after it was incorporated is given by the function f(t) = 30,000 + 2000t. (See next slide for Example 2b.) Solution Table 4.5Population over 20 years Figure 4.7: Town’s population over 20 years Reading Solutions from the Graph (continued) Section 4.3 p41
Example 2b A town’s population t years after it was incorporated is given by the function f(t) = 30,000 + 2000t. (b) Using the table, find the solution to the equation f(t) = 50,000 and indicate the solution on your plot. Solution (b) Looking down the right-hand column of the table we see that the population reaches 50,000 when t = 10, so the solution to the equation f(t) = 50,000 is t = 10. The practical interpretation of the solution t = 10 is that the population reaches 50,000 in 10 years. See Figure 4.7 (previous slide). Reading Solutions from the Graph (continued) Section 4.3 p42
For the function graphed in Figure 4.8, give • (a) f(0) • (b) The value of x such that f(x) = 0. • Figure 4.8 Example 3 Reading Solutions from the Graph (continued) It is important not to confuse the input and the output. Finding the output from the input is a matter of evaluating the function, whereas finding the input (or inputs) from the output is a matter of solving an equation. Solution (a) Since the graph crosses the y-axis at the point (0, 3), we have f(0) = 3. (b) Since the graph crosses the x-axis at the point (−2, 0), we have f(−2) = 0, so x = −2. Section 4.3 p43
Reading Solutions from the Graph (continued) The value where the graph crosses the vertical axis is called the vertical intercept or y-intercept, and the values where it crosses the horizontal axis are called the horizontal intercepts, or x-intercepts. In Example 3, the vertical intercept is y = 3, and the horizontal intercept is x = −2. Section 4.3 p44
How Do We Know When Two Functions Are Equal? Often, we want to know when two functions are equal to each other. That is, we want to find the input value that produces the same output value for both functions. To do this, we set the two outputs equal to each other and solve for the input value. Section 4.3 p45
The populations, in year t, of two towns are given by the functions • Town A : P(t) = 600 + 100(t − 2000) • Town B : Q(t) = 200 + 300(t − 2000). • Write an equation whose solution is the year in which the two towns have the same population. • (See next slide for Example 4b.) Example 4a Solution (a) We want to find the value of t that makes P(t) = Q(t), so we must solve the equation 600 + 100(t − 2000) = 200 + 300(t − 2000). How Do We Know When Two Functions Are Equal? (continued) Section 4.3 p46
The populations, in year t, of two towns are given by the functions Town A : P(t) = 600 + 100(t − 2000) Town B : Q(t) = 200 + 300(t − 2000). (b) Make a table of values of the populations for the years 2000–2004 and find the solution to the equation in part (a). Example 4b Solution (b) From Table 4.6, we see that the two populations are equal in the year t = 2002. Table 4.6 Checking the populations in that year, we see P(2002) = 600 + 100(2002− 2000) = 800 Q(2002) = 200 + 300(2002− 2000) = 800. How Do We Know When Two Functions Are Equal? (continued) Section 4.3 p47
How Do We Know When Two Functions Are Equal? (continued) Example 5a (a) Write an inequality whose solution is the years for which the population of Town A is greater than the population of Town B in Example 4. (See next slide for Example 5b.) Solution (a) We want to find the values of t that make P(t) > Q(t), so we must solve the inequality 600 + 100(t − 2000) > 200 + 300(t − 2000). Functions and Inequalities Sometimes, rather than wanting to know where two functions are equal, we want to know where one is bigger than the other. Section 4.3 p48
How Do We Know When Two Functions Are Equal? (continued) (b) Solve the inequality by graphing the populations. Solution 5b (b) In Figure 4.9, the point where the two graphs intersect is (2002, 800), because the populations are both equal to 800 in the year 2002. To the left of this point, the graph of P (the population of town A) is higher than the graph of Q (the population of town B), so town A has the larger population when t < 2002. Figure 4.9: When is the population of Town A greater than Town B? Example 5b Functions and Inequalities (continued) Section 4.3 p49
4.3 FUNCTIONS AND EQUATIONS Key Points • Solving equations • Finding input values that produce a specific output • Finding input values that make one function equal to another • Finding input values that make one function larger or smaller than another Section 4.3 p50