Download
1 / 28
280 likes | 378 Vues
Discover the key findings from ocean modeling studies on the variability of the Meridional Overturning Circulation (MOC) and its relation to heat transport. Explore the roles of Nordic Seas overflows and Labrador Sea convection, along with the impacts of Agulhas Leakage. Learn about changes in deep water formation and the interplay between northern and southern influences in MOC dynamics.

E N D
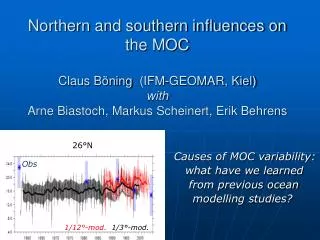
Northern and southern influences on the MOCClaus Böning(IFM-GEOMAR, Kiel)withArne Biastoch, Markus Scheinert, Erik Behrens Causes of MOC variability: what have we learned from previous ocean modelling studies? 26°N Obs 1/12°-mod. 1/3°-mod.
Relation between MOC and heat transport? Biastoch, Böning, Getzlaff, et al. (J. Climate, 2006) • Role of Nordic Seas (Overflows) vs. Labrador Sea (Convection)? Schweckendiek and Willebrand (J. Climate, 2005) Latif, Böning, Willebrand, et al. (J. Climate, 2006) • Relation convection - MOC? Böning, Scheinert, Dengg, et al. (GRL, 2006) • Changes in deep water formation vs. wind stress? Biastoch, Böning, Getzlaff, et al. (J. Climate, 2006) ----------------------- • Effects of Agulhas Leakage (I): wave mechanism Biastoch, Böning, Lutjeharms (Nature, 27 Nov 2008) • Effects of Agulhas Leakage (II): advection Biastoch, Böning, Schwarzkopf, Lutjeharms (Nature, 26 Nov 2009)
MOC and heat transport Model simulations: Close correspondence between MOC and heat transport in the subtropical North Atlantic 1.6 Heat transport (PW) 0.6 26°N 20 MOC (Sv) 10
MOC and heat transport … but caution: Correlation 1 r 0 1.6 Heat transport (PW) 0.6 MOC (in depth-coordinates) is a useful index only south of ~43°N 20°S 0° 20° 40° 60°N based on monthly and2-yr-filtered time series time series
Changes in deep water formation: effect on MOC? (I) Labrador Sea: deep winter mixing (II) Outflow from the Nordic Seas:
Role of changes in overflow vs. convection OGCM study by Schweckendiek & Willebrand (J. Clim., 2005) North Atlantic model, northern boundary: 70°N forced by anomalies from IPCC climate runs MOC (40°N) Greenland- Scotland sill OGCM Climate Model (GFDL) south 66° 70°N 1960 2000 2040 2080
Role of changes in overflow vs. convection OGCM study by Schweckendiek & Willebrand (J. Clim., 2005) North Atlantic model: northern boundary: 70°N forced by anomalies from IPCC climate runs MOC (40°N) Greenland- Scotland sill OGCM Climate Model (GFDL) south 66° 70°N 1960 2000 2040 2080 (1) The combination of surface forcing and overflow density changes (prescribed in sponge layer 66°-70°N) gives an almost perfect reconstruction of the coupled experiments
Exps. (2) and (3) show: trend related to changing overflow density! 2 3
relation between overflow density and MOC … as shown by a host of modelcases with prescribed changes in the overflow density: Latif, Böning, Willebrand, et al. (J. Climate, 2006)
Labrador Sea deep winter mixing Snapshot of mixed layer depth in March (1/12°-model) 1800 m 1000 200 Greenland important factors: - Surface heat flux (destabilising) - Eddy-flux of fresh water from West Greenland Current (stabilising)
Case study: Permanent shut-down of deep convection Evolution of MOC anomalies (Hovmoeller diagram) Hüttl and Böning, 2006 (1/3°-model)
Hindcast simulation with NCEP-heat flux MOC (43°N) follows the LSW formation rate with a lag of ~ 2 years (r = 0.71) MOC LSW formation 6 – 8 Sv change in LSW formation gives ~2 Sv change in MOC Böning et al., GRL 2006
MOC response to NCEP heat flux variability Years of intense LSW production MOC anomalies (in Sv) in exp. „Heat“ 1 -1 Range of decadal MOC variability: 10-15% of mean transport C.I. = 0.2 Sv
but these decadal MOC changes are masked… … by high-frequency wind-driven variability and eddy effects MOC anomalies related to LSW changes in isolation …and superimposed by wind-driven variability Model case including wind stress variability Biastoch et al. (J. Clim., 2008)
Northern vs. Southern Influences deep-water formation areas Upper Branch North Atlantic Circulation [schematic by G. Holloway]
specifically: Role of the Agulhas System? Approach: two-way nesting of high- resolution regional model (1/10°) in global model domain (1/2°) ORCA025: 25 km grid resolution AG01: 10 km grid resolution ORCA05: 50 km grid resolution Mozambique eddies Africa Agulhas rings Agulhas Current Temperature and velocity at 450m depth
(I) Decadal variability signal induced in Agulhas regime:propagation by waves Boundary Waves Rossby Waves / Agulhas Rings Colour: eddy kinetic energy [Biastoch, Böning, Lutjeharms; Nature, 2008]
Comparison of model runs with and without nest: MOC changes manifested in the NBC at 6°S Hovmoeller-plot: MOC-difference Agulhas-induced MOC-variability of +/- 1.5 Sv, rapidly propagating to the North Atlantic Biastoch, Böning, Lutjeharms (Nature, 2008)
Agulhas-induced MOC variability vs. effect of LSW formation: • Agulhas influence reaches into the North Atlantic • … in tropics comparable to effect of subarctic deepwater formation Standard deviation of interannual MOC strength Complete Forcing Effect of Agulhas variability Effect of LSW [Biastoch, Böning, Lutjeharms; Nature, 2008]
Large-scale Circulation Changes South of Africa Trends 1970s – 2000s: streamfunction wind stress curl …also seen in SSH Latitude of zero SSH: model and Aviso satellite altimetry • Gyre extended poleward due to the shift of the westerlies Biastoch, Böning, Schwarzkopf, Lutjeharms: Nature, 26 Nov 2009
Increase in Agulhas Leakage i.e., Lagrangian transport fraction across the Good Hope section: …during the recent decades (1.2 Sv/decade) GoodHope REF CLIM Biastoch, Böning, Schwarzkopf, Lutjeharms: Nature,26 Nov 2009
Pathways of Agulhas Leakage Example trajectories of virtual floats released along the GoodHope section (T≥10°C) Pathway to the North Atlantic (upper limb of the MOC): - No change in volume transport - but: 25% decrease in freshwater flux [Biastoch et al., Nature, 26 Nov 2009]
Observed salinities in the North Brazil Current … invasion of salty Indian Ocean waters increasing salinity in the NBC near the equator Analysis of historic profiles in NBC core off South America Biastoch, Böning, Schwarzkopf, Lutjeharms: Nature, 26 Nov 2009
Thermocline Changes in the Southern Hemisphere 2000-2004 minus 1968-1972 temperatures Upper ocean (0-200m) Zonally averaged over SW Indian Ocean (30°-50°E, isolines show mean temperatures) Biastoch, Böning, Schwarzkopf, Lutjeharms: Nature, 26 Nov 2009
Nested Agulhas model • High-resolution nest simulates all salient features of the Agulhas Current system • The two-way nesting scheme allows to study the feedback of the Agulhas region on the global circulation • Agulhas leakage dynamics affects decadal variability in Atlantic MOC (wave process) • Mesoscale Agulhas variability has no effect on mean MOC • … but decadal MOC variations of ±1.5 Sv • … quickly reaches into northern hemisphere, with similar magnitude as sub-arctic deepwater formation events • Agulhas leakage change affects Atlantic THC (advective process) • Super-gyre has extended due to poleward shift of the westerlies • The Agulhas leakage has increased • … with no effect on time-mean MOC • … but a 25% increase of the salt export towards the North Atlantic
Conclusions • Aaaa • Bbbb