Is this data easy to draw conclusions from?
270 likes | 552 Vues
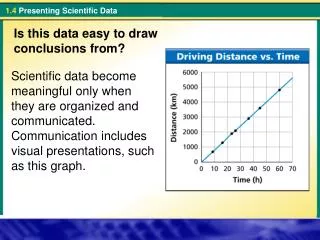
Is this data easy to draw conclusions from?. Scientific data become meaningful only when they are organized and communicated. Communication includes visual presentations, such as this graph. Organizing Data. How do scientists organize data?.

Is this data easy to draw conclusions from?
E N D
Presentation Transcript
Is this data easy to draw conclusions from? Scientific data become meaningful only when they are organized and communicated. Communication includes visual presentations, such as this graph.
Organizing Data How do scientists organize data? Scientists can organize their data by using data tables and graphs.
Organizing Data Data Tables This table relates two variables—a manipulated variable (location) and a responding variable (average annual precipitation).
Organizing Data Line Graphs A line graph is useful for showing changes that occur in related variables. • In a line graph, the manipulated variable is generally plotted on the horizontal axis, or x-axis. • The responding variable is plotted on the vertical axis, or y-axis, of the graph.
Organizing Data Sometimes the data points in a graph yield a straight line. • The steepness, or slope, of this line is the ratio of a vertical change to the corresponding horizontal change. • The formula for the slope of the line is
Organizing Data Plotting the mass of water against the volume of water yields a straight line.
Organizing Data A direct proportion is a relationship in which the ratio of two variables is constant. The relationship between the mass and the volume of water is an example of a direct proportion. • A 3-cubic-centimeter sample of water has a mass of 3 grams. • A 6-cubic-centimeter sample of water has a mass of 6 grams. • A 9-cubic-centimeter sample of water has a mass of 9 grams.
Organizing Data This graph shows how the flow rate of a water faucet affects the time required to fill a 1-gallon pot.
Organizing Data An inverse proportion is a relationship in which the product of two variables is a constant. • A flow rate of 0.5 gallon per minute will fill the pot in 2 minutes. • A flow rate of 1 gallon per minute will fill the pot in 1 minute. • A flow rate of 2 gallons per minute will fill the pot in 0.5 minute.
Organizing Data The table shows the data transfer rates for modems used in home computers. Data transfer rates are often measured in kilobits per second, or kbps. The time required to upload a 1-megabyte (MB) file is given for each rate listed.
Organizing Data • Using GraphsUse the data in the table to create a line graph. Describe the relationship between data transfer rate and upload time.
2. Inferring How would doubling the data transfer rate affect the upload time?
Organizing Data 2. Inferring How would doubling the data transfer rate affect the upload time? Answer: Doubling the data transfer rate would halve the upload time.
Organizing Data Bar Graphs A bar graph is often used to compare a set of measurements, amounts, or changes.
Organizing Data Circle Graphs If you think of a pie cut into pieces, you have a mental model of a circle graph. A circle graph shows how a part or share of something relates to the whole.
Communicating Data How can scientists communicate experimental data? Scientists can communicate results by writing in scientific journals or speaking at conferences.
Communicating Data Scientists also exchange information through conversations, e-mails, and Web sites. Young scientists often present their research at science fairs, which we call poster sessions.
Communicating Data Peer review is a process in which scientists examine other scientists’ work. • Peer review encourages comments, suggestions, questions, and criticism from other scientists. • Based on their peers’ responses, the scientists who submitted their work for review can then reevaluate how to best interpret their data.
Assessment Questions • Which type of graph is most useful for showing how part of something relates to the whole? • bar • circle • column • line
Assessment Questions • Which type of graph is most useful for showing how part of something relates to the whole? • bar • circle • column • lineANS: B
Assessment Questions • How does a line graph generally show the relationship between the manipulated variable and the responding variable? • The manipulated variable is plotted on the x-axis, and the responding variable is plotted on the y-axis. • The responding variable is plotted on the x-axis, and the manipulated variable is plotted on the y-axis. • The manipulated variable is plotted on the graph, and the responding variable is shown by the slope. • The responding variable is plotted on the graph, and the manipulated variable is shown by the slope.
Assessment Questions • How does a line graph generally show the relationship between the manipulated variable and the responding variable? • The manipulated variable is plotted on the x-axis, and the responding variable is plotted on the y-axis. • The responding variable is plotted on the x-axis, and the manipulated variable is plotted on the y-axis. • The manipulated variable is plotted on the graph, and the responding variable is shown by the slope. • The responding variable is plotted on the graph, and the manipulated variable is shown by the slope.ANS: A
Assessment Questions • How do scientists communicate the results of scientific investigations? • by writing in scientific journals or speaking at conferences • using secret code • only through e-mail • by writing in literary journals
Assessment Questions • How do scientists communicate the results of scientific investigations? • by writing in scientific journals or speaking at conferences • using secret code • only through e-mail • by writing in literary journalsANS: A
Assessment Questions • Why is peer review an important part of the scientific process? • Peer review makes sure that the correct researcher gets credit for discoveries. • Peer review helps identify errors or bias in research. • Peer review is the system used to report information to other scientists. • Peer review helps other scientists form theories about a discovery.
Assessment Questions • Why is peer review an important part of the scientific process? • Peer review makes sure that the correct researcher gets credit for discoveries. • Peer review helps identify errors or bias in research. • Peer review is the system used to report information to other scientists. • Peer review helps other scientists form theories about a discovery.ANS: B