Download
1 / 17
170 likes | 369 Vues
6.4 Select and Draw Conclusions from Samples. p. 406 What are methods for collecting samples? What is an unbiased sample? What is a biased sample? What is margin of error?. Vocabulary. Population --a group of people or objects that you want information about.

E N D
6.4 Select and Draw Conclusions from Samples p. 406 What are methods for collecting samples? What is an unbiased sample? What is a biased sample? What is margin of error?
Vocabulary Population--a group of people or objects that you want information about. Sample—a subset of the population when it is too difficult, time-consuming, or expensive to survey everyone in a population.
Sample Types • Self-selected sample—members of a types who volunteered to be in the sample • Systematic sample—members of a population are selected by using a rule (ex: every other person) • Convenient sample—easy to reach members of a population. • Random sample—each member of a population has an equal chance of being selected.
Classifying Samples Baseball A sportswriter wants to survey college baseball coaches about whether they think wooden bats should be mandatory throughout college baseball. Identify the type of sample described. • The sportswriter contacts only the coaches that he has cell phone numbers for in order to get quick responses. SOLUTION • The sportswriter selected coaches that are easily accessible. So, the sample is a convenience sample.
Classifying Samples Baseball A sportswriter wants to survey college baseball coaches about whether they think wooden bats should be mandatory throughout college baseball. Identify the type of sample described. • The sportswriter mails out surveys to all the coaches and uses only the surveys that are returned. SOLUTION • The coaches can choose whether or not to respond. So, the sample is a self-selected sample.
Unbiased and Biased Samples An unbiased sample is representative of the population you want information about. A biased sample over-represents or underrepresents part of the population. In order to draw accurate conclusions about a population from a sample, an unbiased sample should be selected.
Biased Sample Concert Attendance The manager of a concert hall wants to know how often people in the community attend concerts. The manager asks 50 people standing in line for a rock concert how many concerts per year they attend. Tell whether the sample is biased or unbiased. Explain your reasoning. SOLUTION The sample is biased because people standing in line for a rock concert are more likely to attend concerts than people in general.
Generate: 40 unique random integers from 1 to 324 using the randIntfeature of a graphing calculator. The screen at the left shows six such random integers. Unbiased sample Senior Class Prom You are a member of the prom committee. You want to poll members of the senior class to find out where they want to hold the prom. There are 324 students in the senior class. Describe a method for selecting a random sample of 40 seniors to poll. STEP 1 Make: a list of all 324 seniors. Assign each senior a different integer from 1 to 324. STEP 2 If while generating the integers you obtain a duplicate, discard it and generate a new, unique integer as a replacement. Choose: the 40 students that correspond to the 40 integers you generated in Step 2. STEP 3
SCHOOL WEBSITE:A computer science teacher wants to know if students would like the morning announcements posted on the school’s website. He surveys students in one of his computer science classes. Identify the type of sample described, and tell whether the sample is biased. SOLUTION The computer science teacher surveys students in one of his computer science classes where students are easy to reach. So, the sample is a convenience sample. The sample is biased as the students of only the computer class are surveyed.
2. WHAT IF? In Example 3, what is another method you could use to generate a random sample of 40 students? SOLUTION Place each student’s name on a small piece of paper in a hat and draw 40 names.
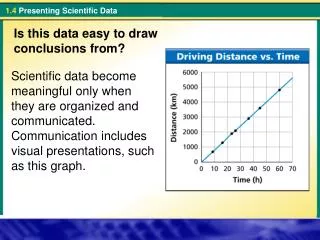
Sample Sizes When conducting a survey, you need to make the size of your sample large enough so that it accurately represents the population. As the sample size increases, the margin of error decreases. The margin of error gives a limit on how much the responses of the sample would differ from the responses of the population. Margin of error formula: Margin of error = This means that if the percent of the sample responding a certain way is p (expressed as a decimal), then the percent of the population that would respond the same way is likely to be between and .
MEDIA SURVEY In a survey of 1011 people, 52% said that television is their main source of news. 1 = n = 0.031 + + + + – – – – 1 The margin of error for the survey is about 3.1%. ANSWER 1011 • What is the margin of error for the survey? SOLUTION • Use the margin of error formula. Margin of error Write margin of error formula. Substitute 1011for n. Use a calculator.
ANSWER It is likely that the exact percent of all people who use television as their main source of news is between 48.9% and 55.1%. • Give an interval that is likely to contain the exact percent of all people who use television as their main source of news. • To find the interval, subtract and add 3.1% to the percent of people surveyed who said television is their main source of news (52%). 52% – 3.1% = 48.9% 52% + 3.1% = 55.1%
D B A The correct answer is C. ANSWER C 1 n n n + + + + – – – – 1 = 0.05 1 = 0.05 Substitute for margin error. 0.0025 = SOLUTION Use the margin of error formula. Margin of error Write margin of error formula. Square each side. n=400 Solve for n. There were 400 people surveyed.
3. INTERNET: In a survey of 1202 people, 11% said that they use the Internet or e-mail more than 10 hours per week. What is the margin of error for the survey? How many people would need to be surveyed to reduce the margin of error to 2%? 1 + n – = + + + + – – – – = 1 1202 0.029 The margin of error for the survey is about 2.9%. SOLUTION Margin of error Write margin of error formula. Substitute 1202 for n. Use a calculator.
3. INTERNET: In a survey of 1202 people, 11% said that they use the Internet or e-mail more than 10 hours per week. How many people would need to be surveyed to reduce the margin of error to 2%? 1 = + – 1 = 0.05 Substitute for margin error. 0.0004 = 1 n n n + + + + – – – – 0.02 ANSWER 2500 people need to be surveyed. Use the margin of error formula. Margin of error Write margin of error formula. Square each side. n= 2500 Solve for n.
6.4 Assignment Page 410, 3-5 all, 6-20 even, 27-30all