“Children at Risk” Program and Academic Performance
100 likes | 239 Vues
“Children at Risk” Program and Academic Performance. Jennifer Lachman jl1290b@american.edu American University School of International Service. Research Question. Did the “Children at Risk” program successfully improve participants’ academic achievement?. Background Info.

“Children at Risk” Program and Academic Performance
E N D
Presentation Transcript
“Children at Risk” Program and Academic Performance Jennifer Lachman jl1290b@american.edu American University School of International Service
Research Question Did the “Children at Risk” program successfully improve participants’ academic achievement?
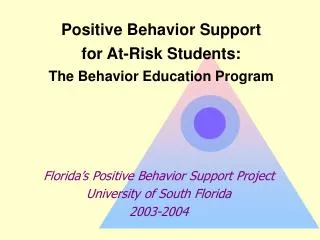
Background Info • Children at Risk (CAR) launched in 1992 • Objectives: Improve academic advancement, prevent drug use, and enhance the security of at-risk adolescents. • Activities: Variety of services including case management, mentoring, out-of-school activities, and educational assistance. • Target population: Middle school students in neighborhoods of severe poverty, high crime, and social distress.
Design #1: Longitudinal Quasi-experimental P1 X P2 X P3 P4 C1 C2 C3 C4 Project participants Comparison group baseline midterm end of project evaluation post project evaluation
Data • Source: The Urban Institute • Data set: Pre-, post-, and ex-post survey and school/police record data for treatment and control samples • Dependent variable: GPA in yr 3 of program (Interval-ratio), Promotion in yr 3 of program (ordinal) • Primary independent variables : Project participation (nominal/dummy), positive attitude toward self (ordinal/dummy), gender (nominal/dummy), absentee rate in yr 3 of program (I-R), GPA pre-program (I-R)
Analysis 1: T-Test Null = No sig. difference between treatment and control groups T statistic (obtained) = .598 Sig. (obtained) = .598 T statistic (critical) = 1.96 Sig. (critical) = .05 Fail to reject the null No significant difference
Analysis 2: Regression Analysis Adjusted R2 = .369
Analysis 3 – Cross Tabs Chi square Gamma Value = .001 Value = .003 Asymp. Sig. = .98 Approx. Sig. = .98 Fail to reject the null No significant difference
Conclusion • “Children at Risk” did not succeed in improving participants’ academic achievement • Findings suggest that CAR program was a failure • Program design should be revisited and altered to improve effectiveness