NASA Study Flight Software Complexity
Cleared for unlimited release: CL#08-3913. NASA Study Flight Software Complexity. Sponsor: NASA OCE Technical Excellence Program. Task Overview Flight Software Complexity. Growth in Code Size for Robotic and Human Missions. Charter


NASA Study Flight Software Complexity
E N D
Presentation Transcript
Cleared for unlimited release: CL#08-3913 NASA StudyFlight Software Complexity Sponsor: NASA OCE Technical Excellence Program Flight Software Complexity
Task OverviewFlight Software Complexity Growth in Code Size for Robotic and Human Missions Charter Bring forward deployable technical and managerial strategies to effectively address risks from growth in size and complexity of flight software Robotic Human NCSL (Log scale) 1969 Mariner-6 (30) 1975 Viking (5K) 1977 Voyager (3K) 1989 Galileo (8K) 1990 Cassini (120K) 1997 Pathfinder (175K) 1999 DS1 (349K) 2003 SIRTF/Spitzer (554K) 2004 MER (555K) 2005 MRO (545K) 1968 Apollo (8.5K) 1980 Shuttle(470K) 1989 ISS (1.5M) Areas of Interest Clear exposé of growth in NASA FSW size and complexity Ways to reduce/manage complexity in general Ways to reduce/manage complexity of fault protection systems Methods of testing complex logic for safety and fault protection provisions Initiators / Reviewers • Ken Ledbetter, SMD Chief Engineer • Stan Fishkind, SOMD Chief Engineer • Frank Bauer, ESMD Chief Engineer • George Xenofos, ESMD Dep. Chief Engr. Points of Contact • JPL Dan Dvorak, lead • GSFC Lou Hallock • JSC Pedro Martinez • MSFC Leann Thomas • APL Steve Williams
Growth Trends in NASA Flight Software Growth in Code Size for Robotic and Human Missions Note log scale! Robotic Human NCSL (Log scale) NCSL (Log scale) 1969 Mariner-6 (30) 1975 Viking (5K) 1977 Voyager (3K) 1989 Galileo (8K) 1990 Cassini (120K) 1997 Pathfinder (175K) 1999 DS1 (349K) 2003 SIRTF/Spitzer (554K) 2004 MER (555K) 2005 MRO (545K) 1968 Apollo (8.5K) 1980 Shuttle(470K) 1989 ISS (1.5M) NCSL = Non-Comment Source Lines The ‘year’ used in this plot is for a mission is typically the year of launch, or of completion of the primary software. Line counts are either from best available source or direct line counts (e.g., for the JPL and LMA missions). The line count for Shuttle Software is from Michael King, Space Flight Operations Contract Software Process Owner, April 2005 Growth rate ~10X every 10 years Source: Gerard Holzmann, JPL
Software Growth in Human Spaceflight JSCdata The Orion (CEV) numbers are current estimates. To make Space Shuttle and Orion comparable, neither one includes backup flight software since that figure for Orion is TBD. 1244 650 8.5 (8500 lines) Source: Pedro Martinez, JSC
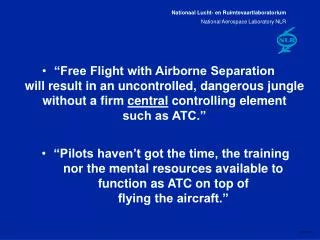
Software Growth in Military Aircraft • Flight software is growing because it is providing an increasing percentage of system functionality • With the newest F-22 in 2000, software controls 80% of everything the pilot does • Designers put functionality in software or firmware because it is easier and/or cheaper than hardware “Crouching Dragon, Hidden Software: Software in DoD Weapon Systems”, Jack Ferguson, IEEE Software, vol. 18, no. 4, pp.105-107, Jul/Aug, 2001.
DefinitionWhat is Complexity? • Complexity is a measure of how hard something is to understand or achieve • Components — How many kinds of things are there to be aware of? • Connections — How many relationships are there to track? • Patterns — Can the design be understood in terms of well-defined patterns? • Requirements — Timing, precision, algorithms • Two kinds of complexity: • Essential Complexity – How complex is the underlying problem? • Incidental Complexity – What extraneous complexity have we added? • Complexity appears in at least four key areas: • Complexity in requirements • Complexity of the software itself • Complexity of testing the system • Complexity of operating the system “Complexity is a total system issue, not just a software issue.” – Orlando Figueroa
Why is Flight Software Growing? “The demand for complex hardware/software systems has increased more rapidly than the ability to design, implement, test, and maintain them. … It is the integrating potential of software that has allowed designers to contemplate more ambitious systems encompassing a broader and more multidisciplinary scope, and it is the growth in utilization of software components that is largely responsible for the high overall complexity of many system designs.” Michael Lyu Handbook of Software Reliability Engineering, 1996
Command sequencing Telemetry collection & formatting Attitude and velocity control Aperture & array pointing Configuration management Payload management Fault detection and diagnosis Safing and fault recovery Critical event sequencing Momentum management Aerobraking Fine guidance pointing Data priority management Event-driven sequencing Surface sample acquisition and handling Surface mobility and hazard avoidance Relay communications Science event detection Automated planning and scheduling Operation on or near small bodies Guided atmospheric entry Tethered system soft landing Interferometer control Dynamic resource management Long distance traversal Landing hazard avoidance Model-based reasoning Plan repair Guided ascent Rendezvous and docking Formation flying Opportunistic science and so on . . . Past Planned Future Causes of Software GrowthExpanding Functions “Flight software is a system’s complexity sponge.” High level commanding Profiled pointing and control Motion compensation Robot arm control Data storage management Data encoding/decoding Data editing and compression Parachute deployment Guided descent and landing Trajectory and ephemeris propagation Thermal control Star identification Feature recognition and target tracking Trajectory determination Maneuver planning Ever more complicated, and numerous Source: Bob Rasmussen, JPL
High-risk systems INTERACTIONS Linear Complex Dams High Nuclear plant Aircraft Power grids Marine transport Chemical plants Rail transport Space missions Airways Military early-warning COUPLING (Urgency) Junior college Military actions Trade schools Mining R&D firms Most manufacturing Universities Low Post Office Source: Charles Perrow, “Normal Accidents: Living with High-Risk Technologies”, 1984. Complex interactions and high coupling raise risk of design defects and operational errors
Scope of Study plus Key Findings • Challenging requirements raise downstream complexity (unavoidable) • Lack of requirements rationale permit unnecessary requirements • Requirements volatility creates a moving target for designers Requirements Complexity System-Level Analysis & Design • Engineering trade studies not done: a missed opportunity • Architectural thinking/review needed at level of systems and software • Inadequate software architecture and poor implementation • General lack of design patterns (and architectural patterns) • Coding guidelines help reduce defects and improve static analysis • Descopes often shift complexity to operations Flight Software Complexity Verification & Validation Complexity • Growth in testing complexity seen at all centers • More software components and interactions to test • COTS software is a mixed blessing • Shortsighted FSW decisions make operations unnecessarily complex • Numerous “operational workarounds” raise risk of command errors Operations Complexity
Detailed Recommendations Flight Software Complexity
Recommendation 1Education about “effect of x on complexity” • Finding: Engineers and scientists often don’t realize the downstream complexity entailed by their decisions • Seemingly simple science “requirements” and avionics designs can have large impact on software complexity, and software decisions can have large impact on operational complexity • Recommendations: • Educate engineers about the kinds of decisions that affect complexity • Intended for systems engineers, subsystem engineers, instrument designers, scientists, flight and ground software engineers, and operations engineers • Include complexity analysis as part of reviews • Options: • Create a “Complexity Primer” on a NASA-internal web site (link) • Populate NASA Lessons Learned with complexity lessons • Publish a paper about common causes of complexity
Recommendation 2Emphasize Requirements Rationale • Finding: Unsubstantiated requirements have caused unnecessary complexity. Rationale for requirements often missing or superficial or misused. • Recommendation: Require rationales at Levels 1, 2, 3 • Rationale explains why a requirement exists • Numerical values require strong justification (e.g. “99% data completeness”, “20 msec response”, etc). Why that value rather than an easier value? • Note: NPR 7123, NASA System Engineering Requirements, specifies in an appendix of “best typical practices” that requirements include rationale, but offers no guidance on how to write a good rationale or check it. NASA Systems Engineering Handbook provides some guidance (p. 48). • Options: • Projects should create a “rationale document” for a set of requirements (sometimes better than rationale for individual requirements): • What the mission is trying to accomplish • What the trade studies showed • What needs to be done • Encourage local procedures that mandate rationale • Add to NASA Lessons Learned about lack of rationale • Development team should inform project management about hard-to-meet requirements
Recommendation 3Serious Attention to Trade Studies • Finding: Engineering trade studies often not done or done superficially or done too late • Kinds of trade studies: flight vs. ground, hardware vs. software vs. firmware (including FPGAs), FSW vs. mission ops and ops tools • Possible reasons: schedule pressure, unclear ownership, culture • Recommendation: Ensure that trade studies are properly staffed, funded, and done early enough • Options: • Mandate trade studies via NASA Procedural Requirement • For a trade study between x and y, make it the responsibility of the manager that holds the funds for both x and y • Encourage informal-but-frequent trade studies via co-location (co-location universally praised by those who experienced it) This is unsatisfying because it says “Just do what you’re supposed to do” “As the line between systems and software engineering blurs, multidisciplinary approaches and teams are becoming imperative.” — Jack Ferguson Director of Software Intensive Systems, DoD IEEE Software, July/August 2001
Recommendation 4More Up-Front Analysis & Architecting • Finding: There are clear trends of increasing complexity in NASA missions • Complexity is evident in requirements, FSW, testing, and ops • We can reduce incidental complexity through better architecture • Recommendation: Spend more time up front in requirements analysis and architecture to really understand the job and its solution (What is architecture?) • Architecture is an essential systems engineering responsibility, and the architecture of behavior largely falls to software • Cheaper to deal with complexity early in analysis and architecture • Integration & testing becomes easier with well-defined interfaces and well-understood interactions • Be aware of Conway’s Law (any piece of software reflects the organizational structure that produced it) “Point of view is worth 80 IQ points.” – Alan Kay, 1982 (famous computer scientist)
Architecture Investment “Sweet Spot” Predictions from COCOMO II model for software cost estimation Example: For 1M lines of code, spend ~29% of s/w budget on architecture for optimal ROI 10M SLOC 1M SLOC Fraction of budget spent on rework + architecture 100K SLOC 10K SLOC Trend: The bigger the software, the bigger the fraction to spend on architecture Fraction of budget spent on architecture Note: Prior investment in a reference architecture pays dividends Source: Kirk Reinholtz, JPL
Recommendation 5Software Architecture Review Board • Finding: In the 1990’s AT&T had a standing Architecture Review Board that examined proposed software architectures for projects, in depth, and pointed out problem areas for rework • The board members were experts in architecture & system analysis • They could spot common problems a mile away • The review was invited and the board provided constructive feedback • It helped immensely to avoid big problems • Recommendation: Create a professional architecture review board and add architecture reviews as a best practice (details) • Options: • Insert architecture gates into existing NASA documents • Leverage existing checklists for architecture reviews [8] • Organize a set of “architectural lessons learned” • Consider reviewers from academia and industry for very large projects Maybe similar to Navigation Advisory Group (NAG)
Recommendation 6Grow and Promote Software Architects • Finding: Software architecture is vitally important in reducing incidental complexity, but architecture skills are uncommon and need to be nurtured • Reference: (what is architecture?) (what is an architect?) • Recommendation: Increase the ranks of software architects and put them in positions of authority • Options: • Target experienced software architects for strategic hiring • Nurture budding architects through education and mentoring(think in terms of a 2-year Master’s program) • Expand APPEL course offerings: • Help systems engineers to think architecturally • The architecture of behavior largely falls to software, and systems engineers must understand how to analyze control flow, data flow, resource management, and other cross-cutting issues
Recommendation 7Involve Operations Engineers Early & Often • Findings that increase ops complexity: • Flight/ground trades and subsequent FSW descope decisions often lack operator input • Shortsighted decisions about telemetry design, sequencer features, data management, autonomy, and testability • Large stack of “operational workarounds” raise risk of command errors and distract operators from vigilant monitoring • Recommendations: • Include experienced operators in flight/ground trades and FSW descope decisions • Treat operational workarounds as a cost and risk upper; quantify their cost • Design FSW to allow tests to start at several well-known states (shouldn’t have to “launch” spacecraft for each test!) Findings are from a “gripe session on ops complexity” held at JPL
Recommendation 8Analyze COTS for Testing Complexity • Finding: COTS software provides valuable functionality, but often comes with numerous other features that are not needed. However, the unneeded features often entail extra testing to check for undesired interactions. • Recommendation: In make/buy decisions, analyze COTS software for separability of its components and features, and thus their effect on testing complexity • Weigh the cost of testing unwanted features against the cost of implementing only the desired features COTS software is a mixed blessing
Cautionary Note Some recommendations are common sense, but aren’t common practice. Why not? Some reasons below. • Cost and schedule pressure • Some recommendations require time and training, and the benefits are hard to quantify up front • Lack of Enforcement • Some ideas already exist in NASA requirements and local practices, but aren’t followed because of and because nobody checks for them • Pressure to inherit from previous mission • Inheritance can be a very good thing, but “inheritance mentality” inhibits new ideas, tools, and methodologies • No incentive to “wear the big hat” • Project managers focus on point solutions for their missions, with no infrastructure investment for the future
SummaryBig-Picture Take-Away Message • Flight software growth is exponential, and will continue • Driven by ambitious requirements • More easily accommodates new functions • Naturally accommodates evolving understanding • Complexity decreases with … • Substantiated, unambiguous, testable requirements • Awareness of downstream effects of engineering decisions • Well-chosen architectural patterns, design patterns, and coding guidelines • Fault protection integrated into nominal control (not an add-on) • Faster processors and larger memories (timing and memory margin) • Careful use of COTS software • Architecture addresses complexity • Confront complexity at the start (can’t test away complexity) • Need more architectural thinkers (education, career path) • Architecture reviews (follow AT&T’s example) • See “Thinking Outside the Box” for how to think architecturally
Epilogue • Angst about software complexity in 2008 is the same as in 1968 (See NATO 1968 report, slide) • We build systems to the limit of our ability • In 1968, 10K lines of code was complex • Now, 1M lines of code is complex, for the same price “While technology can change quickly, getting your people to change takes a great deal longer. That is why the people-intensive job of developing software has had essentially the same problems for over 40 years. It is also why, unless you do something, the situation won’t improve by itself. In fact, current trends suggest that your future products will use more software and be more complex than those of today. This means that more of your people will work on software and that their work will be harder to track and more difficult to manage. Unless you make some changes in the way your software work is done, your current problems will likely get much worse.” Winning with Software: An Executive Strategy, 2001 Watts Humphrey, Fellow, Software Engineering Institute, and Recipient of 2003 National Medal of Technology
Reserve Slides Other recommendations Other growth charts Other observations about NASA software Educational notes about software Flight Software Complexity
R9: Invest in reference arch. R10: Technical kickoff R11: Use static analysis tools R12: Fault protection terminology R13: Fault protection review R14: Fault protection education R15: Fund fault containment R16: Use software metrics Software metrics concerns Fault Management Workshop Flight software characteristics Two kinds of complexity Sources of complexity Dietrich Döerner on complexity FSW growth trend Growth in GM auto s/w Residual defects in s/w Software development process State-of-art testing methods Limits to software size? Impediments within NASA Poor practices in NASA NATO 1968 s/w conference Source lines of code What is Architecture? What is an Architect? What is s/w architecture? What is a reference arch? AT&T’s architecture reviews What is static analysis? What is cyclomatic complexity? No silver bullet Aerospace Corp. activities Software complexity primer Audiences briefed References Hyperlinks to Reserve Slides
Topics Not Studied • Model-Based Systems Engineering • Reference Architecture • Formal Methods • Capability Maturity Model Integration (CMMI) • Firmware and FPGAs • Pair Programming • Programming Language • Human Capital
Recommendation 9Invest in Reference Architecture & Core Assets • Finding: Although each mission is unique, they must all address common problems: attitude control, navigation, data management, fault protection, command handling, telemetry, uplink, downlink, etc. Establishment of uniform patterns for such functionality, across projects, saves time and mission-specific training. This requires investment, but project managers have no incentive to “wear the big hat” • Recommendation: Earmark funds for development of a reference architecture (a predefine architectural pattern) and core assets, at each center, to be led and sustained by the appropriate technical line organization, with senior management support • A reference architecture embodies a huge set of lessons learned, best practices, architectural principles, design patterns, etc. • Options: • Create a separate fund for reference architecture (infrastructure investment) • Keep a list of planned improvements that projects can select from as their intended contribution Key See backup slide on reference architecture
Recommendation 10Formalize a ‘Technical Kickoff’ for Projects • Finding: Flight project engineers move from project to project, often with little time to catch up on technology advances, so they tend to use the same old stuff • Recommendation: • Option 1: Hold ‘technical kickoff meetings’ for projects as a way to infuse new ideas and best practices, and create champions within the project • Inspire rather than mandate • Introduces new architectures, processes, tools, and lessons • Supports technical growth of engineers • Option 2: Provide 4-month “sabbatical” for project engineers to learn a TRL 6 software technology, experiment with it, give feedback for improvements, and then infuse it • Steps: • Outline a structure and a technical agenda for a kickoff meeting • Create a well-structured web site with kickoff materials • Pilot a technical kickoff on a selected mission Michael Aguilar, NESC, is a strong proponent
Recommendation 11Static Analysis for Software • Finding: Commercial tools for static analysis of source code are mature and effective at detecting many kinds of software defects, but are not widely used • Example tools: Coverity, Klocwork, CodeSonar • Michael Aguilar of NESC in strong agreement • Recommendation: Provide funds for: (a) site licenses of source code analyzers at flight centers, and (b) local guidance and support • Notes: • Poll experts within NASA and industry regarding best tools for C, C++, and Java • JPL provides site licenses for Coverity and Klocwork
ReferenceWhat is Static Analysis? • Static code analysis is the analysis of computer software that is performed without actually executing programs built from that software. In most cases analysis is performed on the source code. • Kinds of problems that static analysis can detect: • Memory leaks • File handle leaks • Database connection leaks • Mismatched array new/delete • Missing destructor • STL usage errors • API error handling • API ordering checks • Array and buffer overrun • Null pointer dereference • Use after free • Double free • Dead code due to logic errors • Uninitialized variables • Erroneous switch cases • Deadlocks • Lock contentions • Race conditions Source: “Controlling Software Complexity: The Business Case for Static Source Code Analysis”, Coverity, www.coverity.com
Recommendation 12Fault Protection Reference Standardization • Finding: Inconsistency in the terminology for fault protection among NASA centers and their contractors, and a lack of reference material for which to assess the suitability of fault protection approaches to mission objectives. • Example Terminology: Fault, Failure, Fault Protection, Fault Tolerance, Monitor, Response. • Recommendation: Publish a NASA Fault Protection Handbook or Standards Document that provides: • An approved lexicon for fault protection. • A set of principles and features that characterize software architectures used for fault protection. • For existing and past software architectures, a catalog of recurring design patterns with assessments of their relevance and adherence to the identified principles and features. Findings from NASA Planetary Spacecraft Fault Management Workshop Source: Kevin Barltrop, JPL
Recommendation 13Fault Protection Proposal Review • Finding: The proposal review process does not assess in a consistent manner the risk entailed by a mismatch between mission requirements and the proposed fault protection approach. • Recommendation: For each mission proposal generate an explicit assessment of the match between mission scope and fault protection architecture. Penalize proposals or require follow-up for cases where proposed architecture would be insufficient to support fault coverage scope. • Example: Dawn recognized the fault coverage scope problem, but did not appreciate the difficult of expanding fault coverage using the existing architecture. • The handbook or standards document can be used as a reference to aid in the assessment and provide some consistency. Findings from NASA Planetary Spacecraft Fault Management Workshop Source: Kevin Barltrop, JPL
Recommendation 14Fault Protection Education • Finding: Fault protection and autonomy receives little attention within university curricula, especially within engineering programs. This hinders the development of a consistent fault protection culture needed to foster the ready exchange of ideas. • Recommendation: Sponsor or facilitate the addition of a fault protection and autonomy course within a university program, such as a Controls program. • Example: University of Michigan could add a “Fault Protection and Autonomy Course.” Findings from NASA Planetary Spacecraft Fault Management Workshop Source: Kevin Barltrop, JPL
Recommendation 15Fund R&D on Fault Containment • Finding: Given growth trends in flight software, and given current achievable defect rates, the odds of a mission-ending failure are increasing (see slide 43) • A mission with 1 Million lines of flight code, with a low residual defect ratio of 1 per 1000 lines of code, then translates into 900 benign defects, 90 medium, and 9 potentially fatal residual software defects (i.e., these are defects that will happen, not those that could happen) • Bottom line: As more functionality is done in software, the probability of mission-ending software defects increases (until we get smarter) • Recommendation: Extend the concept of onboard fault protection to cover software failures. Develop and test techniques to detect software faults at run-time and contain their effects • One technique: upon fault detection, fall back to a simpler-but-more-verifiable version of the failed software module
Recommendation 16Apply Software Metrics • Finding: No consistency in flight software metrics • No consistency in how to measure and categorize software size • Hard to assess amount and areas of FSW growth, even within a center • NPR 7150.2 Section 5.3.1 (Software Metrics Report) requires measures of software progress, functionality, quality, and requirements volatility • Recommendations: Development organizations should … • collect software metrics per NPR 7150.2 • use metrics as a mgmt tool to assess cost, technical, and schedule progress • compare to historical data for planning and monitoring • seek measures of complexity at code level and architecture level • Save flight software from each mission in a repository for undefined future analyses (software archeology) • Non-Recommendation: Don’t attempt NASA-wide metrics. Better to drive local center efforts. (See slide) “The 777 marks the first time The Boeing Company has applied software metrics uniformly across a new commercial-airplane programme. This was done to ensure simple, consistent communication of information pertinent to software schedules among Boeing, its software suppliers, and its customers—at all engineering and management levels. In the short term, uniform application of software metrics has resulted in improved visibility and reduced risk for 777 on-board software.” Robert Lytz, “Software metrics for the Boeing 777: a case study”, Software Quality Journal, Springer Netherlands
NASA HistoryDifficulties of Software Metrics An earlier attempt to define NASA-wide software metrics foundered on issues such as these Concerns • Will the data be used to: • compare productivity among centers? • compare defect rates by programmer? • reward/punish managers? • How do you compare class A to class B software, or orbiters to landers? • Should contractor-written code be included in a center’s metrics? • Isn’t a line of C worth more than a line of assembly code? • Technical Issues • How shall “lines” be counted? • Blank lines, comments, closing braces, macros, header files • Should auto-generated code be counted? • How should different software be classified? • Software vs. firmware • Flight vs. ground vs. test • Spacecraft vs. payload • ACS, Nav, C&DH, Instrument, science, uplink, downlink, etc • New, heritage, modified, COTS, GOTS
Workshop OverviewNASA Fault Management Workshop • When: April 13-15, 2008, New Orleans • Sponsor: Jim Adams, Deputy Directory, Planetary Science • Web: http://icpi.nasaprs.com/NASAFMWorkshop • Attendance: ~100 people from NASA, Defense, Industry and Academia • Day 1: Case studies + invited talk on history of spacecraft fault management. • “Missions of the future need to have their systems engineering deeply wrapped around fault management.” (Gentry Lee, JPL) • Day 2: Parallel sessions on (1) Architectures, (2) Verification & Validation, and (3) Practices/Processes/Tools + invited talk on importance of software architecture + poster session • “Fault management should be ‘dyed into the design’ rather than ‘painted on’ • “System analysis tools haven’t kept pace with increasing mission complexity” • Day 3: Invited talks on new directions in V&V and on model-based monitoring of complex systems + observations from attendees • “Better techniques for onboard fault management already exist and have been flown.” (Prof. Brian Williams, MIT)
What’s Different About Flight Software? FSW has four distinguishing characteristics: • No direct user interfaces such as monitor and keyboard. All interactions are through uplink and downlink. • Interfaces with numerous flight hardware devices such as thrusters, reaction wheels, star trackers, motors, science instruments, temperature sensors, etc. • Executes on radiation-hardened processors and microcontrollers that are relatively slow and memory-limited. (Big source of incidental complexity) • Performs real-time processing. Must satisfy numerous timing constraints (timed commands, periodic deadlines, async event response). Being late = being wrong.
Two Sources of Software Complexity • Essential complexity comes from problem domain and mission requirements • Can reduce it only by descoping • Can move it (e.g. to ops), but can’t remove it FSW complexity = Essential complexity + Incidental complexity • Incidental complexity comes from choices about architecture, design, implementation, including avionics • Can reduce it by making wise choices
Good Description of Complexity “Complexity is the label we give to the existence of many interdependent variables in a given system. The more variables and the greater their interdependence, the greater that system’s complexity. Great complexity places high demands on a planner’s capacities to gather information, integrate findings, and design effective actions. The links between the variables oblige us to attend to a great many features simultaneously, and that, concomitantly, makes it impossible for us to undertake only one action in a complex system. … A system of variables is ‘interrelated’ if an action that affects or is meant to affect one part of the system will also affect other parts of it. Interrelatedness guarantees that an action aimed at one variable will have side effects and long-term repercussions.” Dietrich Dörner, 1996 The Logic of Failure
Factors that Increase Software Complexity • Human-rated Missions • May require architecture redundancy and associated complexity • Fault Detection, Diagnostics, and Recovery (FDDR) • FDDR requirements may result in complex logic and numerous potential paths of execution • Requirements to control/monitor increasing number of system components • Greater computer processing, memory, and input/output capability enables control and monitor of more hardware components • Multi-threads of execution • Virtually impossible to test every path and associated timing constraints • Increased security requirements • Using commercial network protocols may introduce vulnerabilities • Including features that exceed requirements • Commercial Off the Shelf (COTS) products or re-use code may provide capability that exceeds needs or may have complex interactions Source: Cathy White, MSFC
109 108 107 106 105 104 103 1970 1980 1990 2000 2010 Flight Software Growth Trend: JPL Missions With a vertical axis of size x speed, this chart shows growth keeping pace with Moore’s Law JPLdata MSL MER Pathfinder, MGS, DS1… Size Speed (bytes MIPS) Cassini MO Doubling time < 2 years GLL, Magellan • Consistent with Moore’s Law • (i.e., bounded by capability) VGR Viking Launch Year Source: Bob Rasmussen, JPL
Growth in Automobile Software at GM References: • www.techweb.com/wire/software/showArticle.jhtml?articleID=51000353 • www.eweek.com/c/a/Enterprise-Apps/GM-to-Software-Vendors-Cut-the-Complexity/ “Software per car will average 100 million lines of code by 2010 and is currently the single biggest expense in producing a car.” — Tony Scott, CTO, GM Information Systems & Services (2004) Note log scale!
Technical ReferenceResidual Defects in Software • Each lifecycle phase involves human effort and therefore insertssome defects • Each phase also has reviews and checks and therefore also removes defects • Difference between the insertion and removal rates determines defect propagation rate • the propagation rate at the far right determines the residual defect rate • For a good industry-standard software process, residual defect rate is typically 1-10 per KNCSL • For an exceptionally good process (e.g., Shuttle) it can be as low as 0.1 per KNCSL • It is currently unrealistic to assume that it could be zero…. defect insertion rate 6 23 46 1 residual defects after testing (anomalies) 2 5 25 2 reqs design coding testing 4 20 26 24 defect removal rate Propagation of residual defects S.G. Eick, C.R. Loader et al., Estimating software fault content before coding, Proc. 15th Int. Conf. on Software Eng., Melbourne, Australia, 1992, pp. 59-65
Software Development Processfor Safety- & Mission-Critical Code 1: reduce defect insertion rates 3:reduce risk from residual software defects require- ments design coding testing 2: increase effectiveness of defect removal with tool based techniques requirements capture and analysis tools run-time monitoring techniques property-based testing techniques swfault containment strategies model-based design, prototyping / formalverification techniques, logic model checking, code synthesis methods static source code analysis increased assertion density NASA standard for Reliable C verifiable coding guidelines compliance checking tools test-case generation from requirements / traceability Source: Gerard Holzmann, JPL
How good are state-of-the-art software testing methods? 1 Million lines of code • Most estimates put the number of residual defects for a good software process at 1 to 10 per KNCSL • A residual software defect is a defect missed in testing, that shows up in mission operations • A larger, but unknowable, class of defects is known as latent software defects – these are all defects present in the code after testing that could strike – only some of which reveal themselves as residual defects in a given interval of time. • Residual defects occur in any severity category • A rule of thumb is to assume that the severity ratios drop off by powers of ten: if we use 3 severity categories with 3 being least and 1 most damaging, then 90% of the residual defects will be category 3, 9% category 2, and 1% category 1 (potentially fatal). • A mission with 1 Million lines of flight code, with a low residual defect ratio of 1 per KNCSL, then translates into 900 benign defects, 90 medium, and 9 potentially fatal residual software defects (i.e., these are defects that will happen, not those that could happen) defects caught in unit & integration testing (99%) latent defects (1%) software defects missed in testing residual defects (0.1%) defects that occur in flight conservatively: 100-1,000 severity 1 defects (potentially fatal) (0.001%) conservatively: 1-10 Source: Gerard Holzmann, JPL
Thought ExperimentIs there a limit to software size? Assumptions: • 1 residual defect per 1,000 lines of code (industry average) • 1 in every 100 residual defects occur in the 1st year of operation • 1 in every 1000 residual defects can lead to mission failure • System/software methods are at current state of the practice (2008) 1.0 certainty of failure beyond this size probability of system failure 0.5 beyond this size code is more likely to fail than to work 0.0 code size in NCSL 100M commercial software 50M spacecraft software time Long-term trend: increasing code size with each new mission
Impediments to Software Architecture within NASA • Inappropriate modeling techniques • “Software architecture is just boxes and lines” • “Software architecture is just code modules” • “A layered diagram says it all” • Misunderstanding about role of architecture in product lines and architectural reuse • “A product line is just a reuse library” • Impoverished culture of architecture design • No standards for arch description and analysis • Architecture reviews are not productive • Architecture is limited to one or two phases • Lack of architecture education among engineers • Failure to take architecture seriously • “We always do it that way. It’s cheaper/easier/less risky to do it the way we did it last time.” • “They do it a certain way ‘out there’ so we should too.” • “We need to reengineer it from scratch because the mission is different from all others.” As presented by Prof. David Garlan (CMU) at NASA Planetary Spacecraft Fault Management Workshop, 4/15/08