Analyzing Single Channel Queue Models: Exponential and Constant Service Time Scenarios
This chapter discusses the appropriate queuing models for various service scenarios, including a single repairman with an unlimited pool of customers and variable service times, characterized by an infinite source and exponential service. It also examines a constant service time model, highlighting the formulas for average customers in line, utilization, and total cost in service processes. Ultimately, it provides strategies for minimizing service and waiting costs based on different staffing scenarios. Gain insights into queue management and service efficiency through mathematical modeling.

Analyzing Single Channel Queue Models: Exponential and Constant Service Time Scenarios
E N D
Presentation Transcript
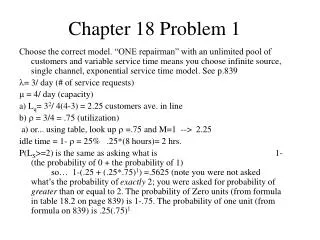
Chapter 18 Problem 1 Choose the correct model. “ONE repairman” with an unlimited pool of customers and variable service time means you choose infinite source, single channel, exponential service time model. See p.839 = 3/ day (# of service requests) = 4/ day (capacity) a) Lq= 32/ 4(4-3) = 2.25 customers ave. in line b) = 3/4 = .75 (utilization) a) or... using table, look up =.75 and M=1 --> 2.25 idle time = 1- = 25% .25*(8 hours)= 2 hrs. P(LS>=2) is the same as asking what is 1-(the probability of 0 + the probability of 1) so… 1-(.25 + (.25*.75)1) =.5625 (note you were not asked what’s the probability of exactly 2; you were asked for probability of greater than or equal to 2. The probability of Zero units (from formula in table 18.2 on page 839) is 1-.75. The probability of one unit (from formula on 839) is .25(.75)1.
Ch 18 problem 2 • Model to use is single channel, constant service time (the time necessary to make a cup of coffee isn’t really variable) see formula on bottom of page 840. • = 80/ hour (# of service requests) • = 120/ hour (capacity) • Lq= 802/2(120)(120-80) =.67 customers in line on avg. • Ws= Wq+ 1/ . Note that Wq= Lq/ So… .67/80 + 1/120= .0167 hrs= 1 minute avg waiting time • Ls= Lq + r (ave # of customers being served, / ) =.67 + 80/120= 1.33 customers in the system
Ch 18 Problem 13 • The problem is a single channel problem. You are adding members to the crew, but still only have one crew. So use single server, exponential service time to get Lq = 2/ (- ). Lq for scenario “2” = 1.44/(2(2-1.2) = .9, for example. • Then, calculate total of cost of service + cost of waiting in all scenarios and pick the lowest total cost scenario. • # /hr /hr Ls @$60/hr (LS=r +Lq) Crew Cost$ TC (r {/} + Lq) * hourly • 2 1.2 2 (1.2/2+ .90)*60=90 20 $110 • 3 1.2 2.4 (1.2/2.4+.50)*60=60 30 $90 • 4 1.2 2.6 (1.2/2.6+.397)*60=51.43 40 $91+