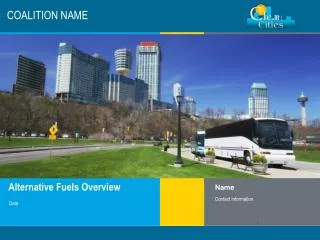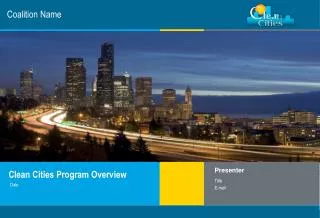
Coalition Name
Coalition Name. Presenter. Title E-mail. Date. Clean Cities Program Overview. Department of Energy. Mission


Coalition Name
E N D
Presentation Transcript
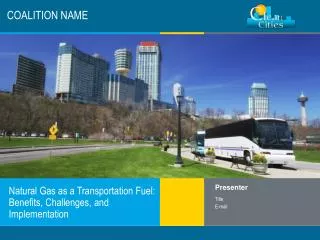
Coalition Name Presenter Title E-mail Date Clean Cities Program Overview
Department of Energy Mission To advance the national, economic, and energy securityof the U.S; to promote scientific and technological innovation in support of that mission; and to ensure the environmental cleanup of the national nuclear weapons complex.
Sponsored by the DOE’s Office of Energy Efficiency and Renewable Energy's Vehicle Technologies program Provides a framework for businesses and governments to work together as a coalition to enhance markets Coordinate activities, identify mutual interests, develop regional economic opportunities, and improve air quality Clean Cities Clean Cities’ Mission To advance the energy, economic, and environmental security of the U.S. by supporting local decisions to adopt practices that contribute to the reduction of petroleum consumption in the transportation sector.
87 active coalitions in 45 states 775,000 AFVs using alternative fuels 6,600 AFV stations 8,400+ stakeholders Clean Cities Today
Clean Cities Stakeholders • Coalitions are made up of local and national stakeholders. • Over 4,000 local stakeholders • 49% private stakeholders
Clean Cities Strengthens Markets • Create jobs and commercial opportunities • Educate fleets, elected officials, and the general public • Encourage the use of alternative technologies • Expand infrastructure • Increase demand and help develop market-driven products • Increase public awareness • Support regulated fleets
Replace petroleum with alternative fuels and low-level blends. Reduce by promoting energy efficiency in vehicles through advanced technologies and more fuel efficient vehicles. Eliminate by promoting idle reduction, greater use of mass transit, trip elimination, and other congestion mitigation approaches. Petroleum Displacement Methods Reduce Replace Eliminate
Fuel Economy Fuel efficiency Behavioral changes Vehicle maintenance initiatives Vehicle miles traveled (VMT) Hybrids Light- and Heavy-duty HEVs PHEVs Idle Reduction Heavy-duty trucks School buses Truck stop electrification Clean Cities Portfolio of Technologies Alternative Fuels and Vehicles • Biodiesel (B100) • Electricity • Ethanol (E85) • Hydrogen • Natural gas • Propane Fuel Blends • Biodiesel/diesel blends (B2, B5, B20) • Ethanol/gasoline blends (E10) • Hydrogen/natural gas blends (HCNG)
2008 Portfolio Performance Petroleum Displacement of Each Portfolio Element *To enable a direct comparison, changes from last year were calculated from 2007 displacement numbers adjusted to remove E10 and transfer B20 from AFV section to blends. Source: Clean Cities Annual Metrics Report 2008, August 2009
Niche Markets Percentage of Total AFVs and HEVs by Niche Market Source: Clean Cities Annual Metrics Report 2008, August 2009
AFVs and Fuel Displacement Number of AFVs and Fuel Displacement by Fuel Type Thousand AFVs Source: Clean Cities Annual Metrics Report 2008, August 2009
AFVs and GHG Reduction Number of AFVs and GHG Reduction by Fuel Type Source: Clean Cities Annual Metrics Report 2008, August 2009
Idle Reduction Projects Displacement Due to Idle Reduction Projects Source: Clean Cities Annual Metrics Report 2008, August 2009
Annual Displacement Projection Displacement Projection Millions of Gallons Source: Clean Cities Annual Metrics Report 2008, August 2009
Displacement Projection and Progress Annual Displacement Projection - Goal and Progress Millions of Gallons Source: Clean Cities Annual Metrics Report 2008, August 2009
Awarded 160 grants worth $34 million Included $66 million from stakeholders 8:1 leveraging of FY2008 program budget Leveraging DOE Investment Breakdown of Grants by Number and Value Source: Clean Cities Annual Metrics Report 2008, August 2009
1,310 activities reaching over 113 million people 3X increase from 2007 Outreach Activities Results for the Seven Types of Outreach Activities Source: Clean Cities Annual Metrics Report 2008, August 2009
Outreach Number of Outreach Activities Split among Audience Types
Clean Cities Web Resources Clean Cities AFDC FuelEconomy.gov
Clean Cities Web site www.eere.energy.gov/ccities Alternative Fuels & Advanced Vehicles Data Center Web site www.eere.energy.gov/afdc Clean Cities Coordinator Contact Information and Coalition Web sites http://www.afdc.energy.gov/cleancities/progs/coordinators.php DOE EERE Information Center and Technical Response Service Web Site: http://www.eere.energy.gov/afdc/informationcenter.html Phone: 1-800-EERE-INF (1-877-337-3463) Email: technicalresponse@icfi.com Hours: 9:00 a.m. – 6:00 p.m. EST Important Web Sites and Resources
Coordinator Name Clean Cities Coalition Contact Information Insert Coalition Logo Contact Information