Download
1 / 51
2.35k likes | 5.23k Vues
Supply-Chain Management. 11. PowerPoint presentation to accompany Heizer and Render Operations Management, 10e Principles of Operations Management, 8e PowerPoint slides by Jeff Heyl. Darden Restaurants. Largest publicly traded casual dining company in the world

E N D
Supply-Chain Management 11 PowerPoint presentation to accompany Heizer and Render Operations Management, 10e Principles of Operations Management, 8e PowerPoint slides by Jeff Heyl © 2011 Pearson Education, Inc. publishing as Prentice Hall
Darden Restaurants • Largest publicly traded casual dining company in the world • Serves over 400 million meals annually in more than 1,800 restaurants in the US and Canada • Annual sales of $6.7 billion • Operations is the strategy © 2011 Pearson Education, Inc. publishing as Prentice Hall
Darden Restaurants • Sources food from five continents and thousands of suppliers • Four distinct supply chains • Over $1.5 billion spent annually in supply chains • Competitive advantage achieved through superior supply chain © 2011 Pearson Education, Inc. publishing as Prentice Hall
Supply-Chain Management The objective is to build a chain of suppliers that focuses on maximizing value to the ultimate customer © 2011 Pearson Education, Inc. publishing as Prentice Hall
The Supply Chain’s Strategic Importance Supply chain management is the integration of the activities that procure materials and services, transform them into intermediate goods and final products, and deliver them through a distribution system Competition is no longer between companies; it is between supply chains © 2011 Pearson Education, Inc. publishing as Prentice Hall
Supply Chain Management Important activities include determining Transportation vendors Credit and cash transfers Suppliers Distributors Accounts payable and receivable Warehousing and inventory Order fulfillment Sharing customer, forecasting, and production information © 2011 Pearson Education, Inc. publishing as Prentice Hall
A Supply Chain for Beer Figure 11.1 © 2011 Pearson Education, Inc. publishing as Prentice Hall
How Supply Chain Decisions Impact Strategy Table 11.1 © 2011 Pearson Education, Inc. publishing as Prentice Hall
How Supply Chain Decisions Impact Strategy Table 11.1 © 2011 Pearson Education, Inc. publishing as Prentice Hall
How Supply Chain Decisions Impact Strategy Table 11.1 © 2011 Pearson Education, Inc. publishing as Prentice Hall
Supply Chain Risk • More reliance on supply chains means more risk • Fewer suppliers increase dependence • Compounded by globalization and logistical complexity • Vendor reliability and quality risks • Political and currency risks © 2011 Pearson Education, Inc. publishing as Prentice Hall
Supply Chain Risk • Mitigate and react to disruptions in • Processes • Controls • Environment © 2011 Pearson Education, Inc. publishing as Prentice Hall
Ethics and Sustainability • Personal ethics • Institute for Supply Management Principles and Standards • Ethics within the supply chain • Ethical behavior regarding the environment © 2011 Pearson Education, Inc. publishing as Prentice Hall
Supply Chain Economics Supply Chain Costs as a Percent of Sales Table 11.3 © 2011 Pearson Education, Inc. publishing as Prentice Hall
Percent of Sales Spent in the Supply Chain Percent Net Profit of Firm 30% 40% 50% 60% 70% 80% 90% 2 $2.78 $3.23 $3.85 $4.76 $6.25 $9.09 $16.67 4 $2.70 $3.13 $3.70 $4.55 $5.88 $8.33 $14.29 6 $2.63 $3.03 $3.57 $4.35 $5.56 $7.69 $12.50 8 $2.56 $2.94 $3.45 $4.17 $5.26 $7.14 $11.11 10 $2.50 $2.86 $3.33 $4.00 $5.00 $6.67 $10.00 Supply Chain Economics Dollars of additional sales needed to equal $1 saved through the supply chain Table 11.4 © 2011 Pearson Education, Inc. publishing as Prentice Hall
Make-or-Buy Decisions • Choice between internal production and external sources © 2011 Pearson Education, Inc. publishing as Prentice Hall
Outsourcing • Transfers traditional internal activities and resources of a firm to outside vendors • Utilizes the efficiency that comes with specialization • Firms outsource information technology, accounting, legal, logistics, and production © 2011 Pearson Education, Inc. publishing as Prentice Hall
Supply Chain Strategies • Negotiating with many suppliers • Long-term partnering with few suppliers • Vertical integration • Joint ventures • Keiretsu • Virtual companies that use suppliers on an as needed basis © 2011 Pearson Education, Inc. publishing as Prentice Hall
Many Suppliers • Commonly used for commodity products • Purchasing is typically based on price • Suppliers compete with one another • Supplier is responsible for technology, expertise, forecasting, cost, quality, and delivery © 2011 Pearson Education, Inc. publishing as Prentice Hall
Few Suppliers • Buyer forms longer term relationships with fewer suppliers • Create value through economies of scale and learning curve improvements • Suppliers more willing to participate in JIT programs and contribute design and technological expertise • Cost of changing suppliers is huge © 2011 Pearson Education, Inc. publishing as Prentice Hall
Vertical Integration Examples of Vertical Integration Vertical Integration Figure 11.2 © 2011 Pearson Education, Inc. publishing as Prentice Hall
Vertical Integration • Developing the ability to produce goods or service previously purchased • Integration may be forward, towards the customer, or backward, towards suppliers • Can improve cost, quality, and inventory but requires capital, managerial skills, and demand • Risky in industries with rapid technological change © 2011 Pearson Education, Inc. publishing as Prentice Hall
Joint Ventures • Formal collaboration • Enhance skills • Secure supply • Reduce costs • Cooperation without diluting brand or conceding competitive advantage © 2011 Pearson Education, Inc. publishing as Prentice Hall
Keiretsu Networks • A middle ground between few suppliers and vertical integration • Supplier becomes part of the company coalition • Often provide financial support for suppliers through ownership or loans • Members expect long-term relationships and provide technical expertise and stable deliveries • May extend through several levels of the supply chain © 2011 Pearson Education, Inc. publishing as Prentice Hall
Virtual Companies • Rely on a variety of supplier relationships to provide services on demand • Fluid organizational boundaries that allow the creation of unique enterprises to meet changing market demands • Exceptionally lean performance, low capital investment, flexibility, and speed © 2011 Pearson Education, Inc. publishing as Prentice Hall
Managing the Supply Chain There are significant management issues in controlling a supply chain involving many independent organizations • Mutual agreement on goals • Trust • Compatible organizational cultures © 2011 Pearson Education, Inc. publishing as Prentice Hall
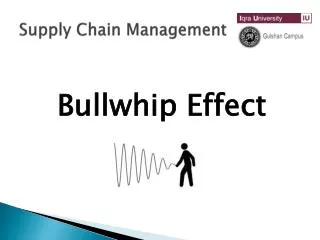
Issues in an Integrated Supply Chain • Local optimization - focusing on local profit or cost minimization based on limited knowledge • Incentives (sales incentives, quantity discounts, quotas, and promotions)- push merchandise prior to sale • Large lots - low unit cost but do not reflect sales • Bullwhip effect- stable demand becomes lumpy orders through the supply chain © 2011 Pearson Education, Inc. publishing as Prentice Hall
Opportunities in an Integrated Supply Chain • Accurate “pull” data • Lot size reduction • Single stage control of replenishment • Vendor managed inventory (VMI) © 2011 Pearson Education, Inc. publishing as Prentice Hall
Opportunities in an Integrated Supply Chain • Collaborative planning, forecasting, and replenishment (CPFR) • Blanket orders • Standardization © 2011 Pearson Education, Inc. publishing as Prentice Hall
Opportunities in an Integrated Supply Chain • Postponement • Drop shipping and special packaging • Pass-through facility • Channel assembly © 2011 Pearson Education, Inc. publishing as Prentice Hall
Radio Frequency Tags: Keeping the Shelves Stocked Supply chains work smoothly when sales are steady, but often break down when confronted by a sudden surge in demand. Radio frequency ID (or RFID) tags can change that by providing real-time information about what’s happening on store shelves. Here’s how the system works for Proctor & Gamble’s Pampers. Radio Frequency Tags © 2011 Pearson Education, Inc. publishing as Prentice Hall
E-Procurement • Uses the internet to facilitate purchasing • Electronic ordering and funds transfer • Electronic data interchange (EDI) • Advanced shipping notice © 2011 Pearson Education, Inc. publishing as Prentice Hall
E-Procurement • Online catalogs • Catalogs provided by vendors • Catalogs published by intermediaries • Exchanges provided by buyers © 2011 Pearson Education, Inc. publishing as Prentice Hall
Vendor Selection • Vendor evaluation • Critical decision • Find potential vendors • Determine the likelihood of them becoming good suppliers • Vendor Development • Training • Engineering and production help • Establish policies and procedures © 2011 Pearson Education, Inc. publishing as Prentice Hall
Vendor Evaluation © 2011 Pearson Education, Inc. publishing as Prentice Hall
Vendor Selection • Negotiations • Cost-Based Price Model- supplier opens books to purchaser • Market-Based Price Model - price based on published, auction, or indexed price • Competitive Bidding - used for infrequent purchases but may make establishing long-term relationships difficult © 2011 Pearson Education, Inc. publishing as Prentice Hall
Logistics Management • Objective is to obtain efficient operations through the integration of all material acquisition, movement, and storage activities • Is a frequent candidate for outsourcing • Allows competitive advantage to be gained through reduced costs and improved customer service © 2011 Pearson Education, Inc. publishing as Prentice Hall
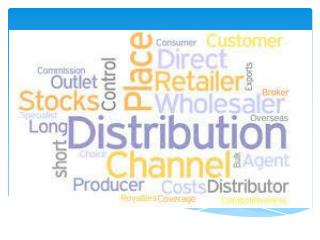
Distribution Systems • Trucking • Moves the vast majority of manufactured goods • Chief advantage is flexibility • Railroads • Capable of carrying large loads • Little flexibility though containers and piggybacking have helped with this © 2011 Pearson Education, Inc. publishing as Prentice Hall
Distribution Systems • Airfreight • Fast and flexible for light loads • May be expensive © 2011 Pearson Education, Inc. publishing as Prentice Hall
Distribution Systems • Waterways • Typically used for bulky, low-value cargo • Used when shipping cost is more important than speed © 2011 Pearson Education, Inc. publishing as Prentice Hall
Distribution Systems • Pipelines • Used for transporting oil, gas, and other chemical products © 2011 Pearson Education, Inc. publishing as Prentice Hall
Third-Party Logistics • Outsourcing logistics can reduce costs and improve delivery reliability and speed • Coordinate supplier inventory with delivery services • May provide warehousing, assembly, testing, shipping, customs © 2011 Pearson Education, Inc. publishing as Prentice Hall
Security and JIT • Borders are becoming more open in the U.S. and around the world • Monitoring and controlling stock moving through supply chains is more important than ever • New technologies are being developed to allow close monitoring of location, storage conditions, and movement © 2011 Pearson Education, Inc. publishing as Prentice Hall
Measuring Supply-Chain Performance Table 11.6 © 2011 Pearson Education, Inc. publishing as Prentice Hall
Total inventory investment Total assets Percent invested in inventory = x 100 Measuring Supply-Chain Performance • Assets committed to inventory Investment in inventory = $11.4 billion Total assets = $44.4 billion Percent invested in inventory = (11.4/44.4) x 100 = 25.7% © 2011 Pearson Education, Inc. publishing as Prentice Hall
Inventory as a % of Total Assets(with exceptional performance) Manufacturing 15%(Toyota 5%) Wholesale 34%(Coca-Cola 2.9%) Restaurants 2.9%(McDonald’s .05%) Retail 27%(Home Depot 25.7%) Measuring Supply-Chain Performance Table 11.7 © 2011 Pearson Education, Inc. publishing as Prentice Hall
Cost of goods sold Inventory investment Inventory turnover = Measuring Supply-Chain Performance • Inventory turnover © 2011 Pearson Education, Inc. publishing as Prentice Hall
Examples of Annual Inventory Turnover Food, Beverage, Retail Manufacturing Anheuser Busch 15 Dell Computer 90 Coca-Cola 14 Johnson Controls 22 Home Depot 5 Toyota (overall) 13 McDonald’s 112 Nissan (assembly) 150 Measuring Supply-Chain Performance Table 11.8 © 2011 Pearson Education, Inc. publishing as Prentice Hall
Net revenue $32.5 Cost of goods sold $14.2 Inventory: Raw material inventory $.74 Work-in-process inventory $.11 Finished goods inventory $.84 Total inventory investment $1.69 Measuring Supply-Chain Performance • Inventory turnover © 2011 Pearson Education, Inc. publishing as Prentice Hall
Inventory turnover Inventory turnover = Net revenue $32.5 Cost of goods sold $14.2 Inventory: Raw material inventory $.74 Work-in-process inventory $.11 Finished goods inventory $.84 Total inventory investment $1.69 Cost of goods sold Inventory investment Measuring Supply-Chain Performance = 14.2 / 1.69 = 8.4 © 2011 Pearson Education, Inc. publishing as Prentice Hall