Download

1 / 31
310 likes | 443 Vues
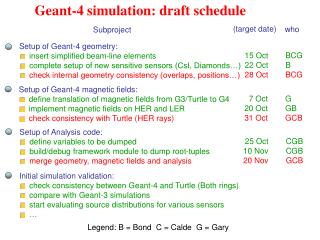
This document presents the Geant4 simulation of the DEPFT (DEPFET) beam test conducted by Daniel Scheirich and colleagues from Charles University, Prague. It describes the validation of the simulation model, including simulation of electron scattering within silicon wafers, residual plots for different geometries and window thicknesses, and comparisons with theoretical predictions. The results demonstrate good agreement between simulated and theoretical data, offering insights into optimizing detector designs for future experiments using various particle beams.

E N D
Geant 4 simulation of the DEPFET beam test Daniel Scheirich, Peter Kodyš, Zdeněk Doležal, Pavel Řezníček Faculty of Mathematics and Physics Charles University, Prague 2-12-2005, Prague
2 Index • Geant 4 simulation program • Model validation • Geometry of the beam test • Unscattered particles • Electron beam simulation • Residual plots for 2 different geometries • Residual plots for 3 different window thickness • CERN 180 GeV pion beam simulation • Conclusions
3 class TDetector class TDetector class TGeometry class TDetector class TGeometry … … Geant 4 simulation program • More about Geant 4 framework at www.cern.ch/geant4 • C++ object oriented architecture • Parameters are loaded from files G4 simulation program g4run.mac class TPrimaryGeneratorAction g4run.config class TDetectorConstruction detGeo1.config detGeo2.config … geometry.config det. position, det. geometry files sensitive wafers
4 Model validation • Simulation of an electron scattering in the 300m silicon wafer • Angular distribution histogram • Comparison with a theoretical shape of the distribution. According to the Particle Physics Review it is approximately Gaussian with a width given by the formula: where p, and z are the momentum, velocity and charge number, and x/X0 is the thickness in radiation length. Accuracy of 0 is 11% or better.
5 Example of an electron scattering Angular distribution electrons Silicon wafer
6 Gaussian fit Theoretical shape Non-gaussian tails
7 Results: simulation vs. theory 0… width of the theoretical Gaussian distribution …width of the fitted Gaussian accuracy of 0parametrisation (theory)is 11% or better Good agreement between the G4 simulation and the theory
8 Geometry of the beam test (DEPFET) Electron beam: 3x3 mm2, homogenous, parallel with x-axis
9 Geometry of the beam test: example
10 Configurations used for the simulation as planned for January 2006 TB – info from Lars Reuen, October 2005 Geometry 1 Module windows: • 50 m copper foils • no foils • 150 m copper foils Geometry 2 Module windows: • 50 m copper foils
11 Unscattered particle • Intersects of an unscattered particle lies on a straight line. • A resolution of telescopes is approximately pitch/(S/N) ~ 2 m. • Positions of intersects in telescopes plane were blurred with a Gaussian to simulate telescope resolution. • These points were fitted by a straight line.
12 Residual R(y) in DUT plane
14 =0.9912 m =0.9928 m =0.9918 m =0.9852 m
15 Unscattered particles: residual plots Geometry 1 = 1.19 m = 1.60 m = 1.60 m = 1.18 m = 0.99 m Geometry 2 = 1.05 m = 1.68 m = 1.68 m = 1.05 m = 0.99 m
16 Electron beamsimulation • There are 2 main contributions to the residual plots RMS: • Multiple scattering • Telescope resolution • Simulation was done for 1 GeV to 5 GeV electrons, 50000 events for each run • Particles that didn’t hit the both scintillators were excluded from the analysis • 2 cuts were applied to exclude bad fits
17 Example of 2 cuts 30% of events, 2 < 0.0005 50% of events, 2 < 0.0013 70% of events, 2 < 0.0025
18 Actual position DUT residual DUT plane Telescope resolution: Gaussian with =2 m
19 Electron beamsimulation: residual plots
20 Electron beamsimulation: residual plots
21 Residual-plot sigma vs. particle energy
22 Residual plots: two geometries Ideal detectors telescopes resolution included
23 Residual plots: two geometries Ideal detectors telescopes resolution included
24 Three windows thicknesses for the geometry 1 Geometry 1 • no foils • 50 m copper foils • 150 m copper foils Module windows:
25 Residual plots: three thicknesses Ideal detectors TEL & DUT resolution included
26 Residual plots: three thicknesses Ideal detectors TEL & DUT resolution included
27 Pion beam simulation • CERN 180 GeV pion beam was simulated • Geometries 1 and 2 were tested
28 Pion beam: residual plots Ideal detectors TEL & DUT resolution included
29 Pion beam: residual plots Ideal detectors TEL & DUT resolution included
30 Conclusions • Software for a simulation and data analysis has been created. Now it’s not a problem to run it all again with different parameters. • There is no significant difference between the geometry 1 and 2 for unscattered particles. • We can improve the resolution by excluding bad fits. • Geometry 2 gives wider residual plots due to amultiple scattering. For 5 GeV electrons and 30% 2 cut = 4.28 m for the Geometry 1 and = 5.94 m for the Geometry 2.
31 Conclusions • For 5 GeV electrons and 30% 2 cut there is approximately 1m difference between simulations with no module windows and 50 m copper windows. • CERN 180 GeV pion beam has a significantly lower multiple scattering. The main contribution to its residual plot width come from the telescopes intrinsic resolution.