Download

1 / 39
390 likes | 535 Vues
The Department of Education. Florida Education: The Next Generation DRAFT. The Next Generation The Strategic Plan Differentiated Accountability. March 13, 2008 Version 1.0. Commissioner of Education Dr. Eric J. Smith Presenter: Chancellor Frances Haithcock.

E N D
The Department of Education Florida Education: The Next GenerationDRAFT • The Next Generation • The Strategic Plan • Differentiated Accountability March 13, 2008 Version 1.0 Commissioner of Education Dr. Eric J. Smith Presenter: Chancellor Frances Haithcock
The Sunshine State Shines Nationally… Quality Counts ranks Florida’s public education system 14th in the nation – up from 31st the previous year-7thin academics. One of only four states in the nation to improve significantly in both fourth and eighth-grade NAEP reading. One of only five states that showed a significant narrowing of the White/African American achievement gap in fourth-grade NAEP reading, and one of only seven states to do the same in eighth-grade NAEP math. Ranks ninth in the nation for the number of eighth-grade students writing at or above the Proficient level on the NAEP. Florida’s Foundation for Success
Florida’s Foundation for Success • Florida has the second greatest number of Hispanic students and fourth greatest number of African-American students writing at or above the Proficient level on the NAEP. • Leads all other states in the number of African-American and Hispanic students passing AP exams. • Ranks fourth in the nation in the percent of 2007 public high school graduates who passed an AP exam. The Sunshine State Shines Nationally…
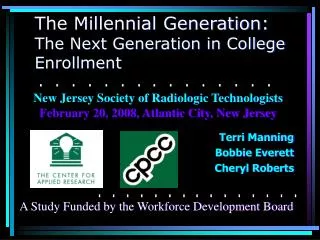
70% 60 58 57 60% 53 52 50 47 47 50% 40% 30% 32 31 29 27 26 20% 22 21 20 10% 0% 2001 2002 2003 2004 2005 2006 2007 2008 Achievement Level 3 and Above (On Grade Level and Above) Achievement Level 1 FCAT Reading by Achievement Level Grades 3-10 In 2008, 60 percent of all students in Grades 3-10 were performing at or above Achievement Level 3 (on grade level and above) on FCAT Reading. This is an increase from 47 percent in 2001, 47 percent in 2002, 50 percent in 2003, 52 percent in 2004, 53 percent in 2005, 57 percent in 2006, and 58 percent in 2007. In 2008, 20 percent of all students in Grades 3-10 were performing at Achievement Level 1 on FCAT Reading. This is a decrease from 32 percent in 2001, 31 percent in 2002, 29 percent in 2003, 27 percent in 2004, 26 percent in 2005, 22 percent in 2006, and 21 percent in 2007. Source: K20 Education Data Warehouse Florida Department of Education, June 2008
50% 42 38 40% 37 37 39 39 38 38 34 33 33 32 32 33 30% 32 30 20% 10% 0% Achievement Level 3 and Above (On Grade Level and Above) Achievement Level 1 2001 2002 2003 2004 2005 2006 2007 2008 FCAT Reading by Achievement Level Grades 9 and 10 In 2008, 42 percent of all students in Grades 9 and 10 were performing at or above Achievement Level 3 (on grade level and above) on FCAT Reading. This is an increase from 32 percent in 2001, 32 percent in 2002, 33 percent in 2003, 33 percent in 2004, 34 percent in 2005, 37 percent in 2006, and 38 percent in 2007. In 2008, 30 percent of all students in Grades 9 and 10 were performing at Achievement Level 1 on FCAT Reading. This is a decrease from 39 percent in 2001, 39 percent in 2002, 38 percent in 2003, 38 percent in 2004, 37 percent in 2005, 33 percent in 2006, and 32 percent in 2007. Source: K20 Education Data Warehouse Florida Department of Education, June 2008
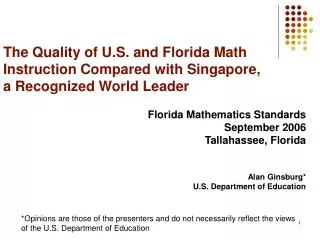
70% 66 63 61 59 60% 56 54 51 50 50% 40% 30% 29 27 20% 24 22 20 18 17 15 10% 0% 2001 2002 2003 2004 2005 2006 2007 2008 Achievement Level 3 and Above (On Grade Level and Above) Achievement Level 1 FCAT Mathematics by Achievement Level Grades 3-10 In 2008, 66 percent of all students in Grades 3-10 were performing at or above Achievement Level 3 (on grade level and above) on FCAT Mathematics. This is an increase from 50 percent in 2001, 51 percent in 2002, 54 percent in 2003, 56 percent in 2004, 59 percent in 2005, 61 percent in 2006, and 63 percent in 2007. In 2008, 15 percent of all students in Grades 3-10 were performing at Achievement Level 1 on FCAT Mathematics. This is a decrease from 29 percent in 2001, 27 percent in 2002, 24 percent in 2003, 22 percent in 2004, 20 percent in 2005, 18 percent in 2006, and 17 percent in 2007. Source: K20 Education Data Warehouse Florida Department of Education, June 2008
Florida’s Foundation for Success This is a good start, but “no such thing as neutral!”
An Expectations Gap: We don’t expect high school graduates to be prepared • Academic standards not aligned with knowledge and skills needed for postsecondary success • Graduation requirements too low • Assessments not meaningfully connected with students’ college or career aspirations • Florida High Schools are held accountable for student performance on 10th grade FCAT, not for preparing students for postsecondary success • RESULT: Students can earn a high school diploma without the skills necessary for success in college and work.
Next Generation Closing the Preparation Gap • Prepare students for postsecondary education and careers Closing the Expectations Gap • Equate a Florida High School Diploma with the knowledge and skills needed for success in postsecondary education and high-skill, high-wage careers
The Next Generation Initiatives • Effective Teacher Instruction • Identify effective instruction practices • Build training around those practices • Reward and incentivize effective performance • Bright Beginnings Reading/Math-VPK-3rd grade • Standards • Diagnostic assessments connected to interventions • Aligned quality lessons • PD • Parent connection
40 Pilots 57 Districts 5 Regions William Cecil Golden Professional Development Tool Monitoring Roles Redefining Psychology goals What works? Reading/Math Summer Institutes Response to Intervention-RtI
The Next Generation Initiatives (cont.) • Next Generation Standards • Rigorous and aligned to college readiness national and international standards V.Next Generation High School • Shift in culture • Higher expectation • Rigorous curriculum • Prepare for college/high-wage, high-skill work force • More rigorous graduation requirements
Redefine Accountability Change school grades formula 50% FCAT 50% other Graduation rate-regular and at risk Acceleration AP, IB, DI, Industry Certified Readiness ACT, SAT, CPT Differentiated Accountability Combines Federal and State accountability Focuses support delivered through regions EOC—Specific and aligned The Next Generation Initiatives (cont.)
Florida The Next Generation Accept the Challenge “Raise the Base, Raise the Ceiling” “Focus on the Important Stuff” “Chipmunks vs. Antelopes”
Florida Education: The Next GenerationDRAFT Florida Education: The Next Generation Join the Journey! March 13, 2008 Version 1.0
Florida’s Next Generation PreK-20 Education Strategic Plan DRAFT October 9, 2008 v1 Strengthen foundation skills Globally Competitive Workforce Improve college and career readiness Expand opportunities for postsecondary degrees and certificates Improve quality of teaching in the education system Improve K-12 educational choice options Align resources to strategic goals Pre-Kindergarten – Grade 3 GRADE 4-8 GRADE 9-12 College / Career
Next Generation PreK-20Strategic Vision (what success looks like) To change the culture of our schools from PreK to postsecondary by raising the ceiling and raising the floor to better enable students for success in the 21st century.
Next Generation PreK-20Benchmarks ** 2007-08 data available in Oct/Nov 2008
Florida’s Differentiated Accountability Pilot Program Florida Education: The Next GenerationDRAFT March 13, 2008 Version 1.0
Model Overview • Florida selected by the US Department of Education July 1, 2008 • Total of six states • Aligns and integrates Florida’s “School Grading” Accountability System with the Federal “NCLB” Accountability • Separates schools with comparatively fewer problem areas with more widespread problem areas • Provides a seamless nine area support system for the two merged accountability programs through a “regional” delivery
Specifics on Categories • Title I Schools are grouped by SINI status, school grade and the percent of AYP criteria met • Non-Title I Repeating F, F, and D schools are included in the model to ensure continued support
School Categories *Non-Title I D schools are included in Prevent II; non-Title I F and Repeating F schools are included in Correct II
Roles of the School, District and State • Prevent I – school directs intervention, district provides assistance, state monitors • Correct I – district directs intervention, state reviews progress • Prevent II – district directs intervention and provides assistance • Correct II – school and district implement state-directed interventions • Intervene – school and district implement state-directed interventions and face possible closure, state monitors
Intervene Selection Criteria I. • D or F Title I school in 2008 OR • Repeating F (two F grades in a four year period), regardless of Title I or SINI status in 2008 AND • Has answered “Yes” to three out of four • Has the percentage of non-proficient students in reading increased since 2003? • Has the percentage of non-proficient students in math increased since 2003? • Are 65 percent or more of the school’s students non-proficient in reading? • Are 65 percent or more of the school’s students non-proficient in math? OR II. Also included are chronic F schools (Title I and non-Title I) that are current Repeating F schools and have earned four F grades in last six school years (2003-2008)
Major Changes • Streamlines two Accountability Systems • Focuses support progressively • Increases requirements as school grades and percent of AYP met declines
Major Changes • Operationalizes services through specific interventions and regional support organized around nine areas: • School Improvement Planning • Leadership • Educator Quality • Professional Development • Curriculum Aligned and Paced • Continuous Improvement Model • Choice with Transportation • Supplemental Educational Services • Monitoring Plans and Processes
Other Major Changes • Supplemental Educational Services offered to SINI 1 – 5+ • Choice with Transportation offered to SINI 2-5+
Budget • Title I, Basic – $445.7M (estimated amount available for Differentiated Accountability schools) • Intervene schools - $3.9M (Title I, Basic and School Improvement funds) • Individuals with Disabilities Education Act (IDEA) • Title III, English Language Acquisition • Regional Statewide Support Centers • $1.8M
Redirecting Funds – Support to Low-Performing Schools • Title I School Improvement Grants - $48M • Supports school and district improvement efforts and aligns resources to engage systemic change in low-performing schools • Extended teacher contract time to support data analysis and curriculum alignment • Professional Learning Communities • Contracting with an outside evaluator • Professional development in non-AYP areas • Implementing a schoolwide reform model • Implementing a new, more rigorous accelerated curriculum • Extending the school day or school year
Redirecting Funds – Support to Low-Performing Schools • Research-based Reading Allocation – $111.5M • Supports comprehensive reading programs, professional development, and research-based materials and strategies • Leadership development • Data analysis • Professional development • Appropriate research-based instructional materials and strategies are used to address specific student needs
Redirecting Funds – Support to Low-Performing Schools • Supplemental Academic Instruction – $702.2M • Supports intensive and extended day/year instruction for Level 1 students • Intensive Reading and Mathematics classes • Extended school day, school year, or summer school • Intensive English immersion
Redirecting Funds – Support to Low-Performing Schools • Florida Partnership Grant - $5.1M (3 Intervene schools) • Supports minority and underrepresented student access to postsecondary education • Professional development training that enhances knowledge of advanced courses • Strategies for the early identification of students who are in the academic middle and are capable of completing a rigorous curriculum • Evidence-based programs to help educators target gaps in student skills
Redirecting Funds – Support to Low-Performing Schools • Gaining Early Awareness and Readiness to Undergraduate Programs (GEAR UP) - $3M/Year for 6 Years • Provides early intervention for prioritized students that will increase student rates of learning, completion and postsecondary enrollment • School-based coaches • Interactive web-based virtual tutoring • On-line practice items and mini-assessments • Before- and after-school programs and summer camps • Curricula designed to assure completion of Algebra by the end of grade 9, with a target completion by the end of grade 8 • Increased curricula rigor and relevance
Redirecting Funds – Support to Low-Performing Schools • Advanced Placement Incentive Program – $600,000/Year for 3 Years • Supports the participation of low-income students in Advanced Placement courses • Increase number of secondary and low-income students enrolled in AP courses • Increase the scores earned at each school by secondary and low-income students • AVID • Access to Florida Virtual School online AP • Introduction of critical need language AP course/programs in targeted schools • Teacher professional development for AP courses • Teacher incentives for successful AP students
Redirecting Funds – Support to Low-Performing Schools • Southern Regional Education Board – $500,000/Year for 3 Years (1 Intervene school) • Increases academic rigor in middle and high schools, readiness for and enrollment in postsecondary education, and trains teacher leaders to assume administrative roles in low-performing schools • College-level coursework and readiness • Leadership academy to train and support school leadership teams • Extended day and school year • Quality career studies • Revise master schedules • High Schools That Work reform model • Making Middle Grades Work reform model • School improvement coaches