Conservation Genetics
Conservation Genetics Currently (2004) the IUCN (International Union for the Conservation of Nature) estimates there have been 784 documented extinctions in 500 years. Surprisingly 50% of documented extinctions in last 20 years have occurred on continents.

Conservation Genetics
E N D
Presentation Transcript
Conservation Genetics Currently (2004) the IUCN (International Union for the Conservation of Nature) estimates there have been 784 documented extinctions in 500 years. Surprisingly 50% of documented extinctions in last 20 years have occurred on continents. One way to compare Contemporary vs. Historical rates of extinction is to compare average species lifespans: In the fossil record the avgerage lifespan of a species is 1-10 myrs.
In last century, bird and mammal extinctions correspond to a lifespan of only 10,000 yrs i.e. 1/1000 of the average span in the fossil record. If current trends continue, average lifespan can be predicted to be as low as 200-400 yrs: 1/5000 – 1/25000 of the span in the fossil record. In the IUCN Red List, 15,589 species face extinction: 33% of amphibians of which 21% are critical 25% of mammals 12.5% of birds These numbers are based on known species, or about 3% of the 1.9 x 10⁶ named.
There are many more in decline but not on the IUCN red list: from McKinney and Lockwood (1999) We already know the main proximate causes: 1) Habitat loss / degradation; 2) Species Introductions; 3) Exploitation; 4) Climate Change
The ultimate cause: to steal from an old comic strip, Pogo, “We have met the enemy, and he is us.” i.e. human population growth and total population size. To reduce the risk of extinctions we need to identify species of conservation priority. Often assessment is at an easily identifiable level, based on basic population data… presence/ absence Recruitment abundance Age structure richness Diversity
The Shortcomings of Census data 1. Such metrics are useful but may identify a threat much too late for recovery programmes to be effective. 2. Census data cannot reveal possible threats to the persistence of a species that are detectable at the molecular level even before there is numerical evidence of a threat. Surveys of Genetic variation provide direct & indirect indicators of the ‘health’ of a population or species.
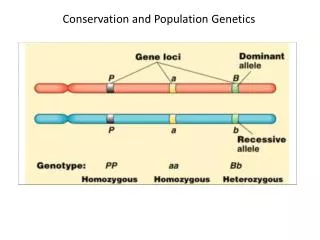
Some basic Genetic ideas: • Both evolution and environment act on • phenotypes. • Phenotypic traits are influenced by genotypic • variation. • Both the environment and allelic interactions • during gene expression affect an individuals • phenotype.
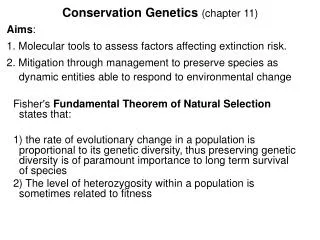
Genetic diversity is usually measured at three levels: 1. Within Individual (heterozygosity) 2. Among individuals in a population 3. Among populations The basic theorem about evolutionary change was developed by Sir Ronald Fisher. Fisher’s theorem: The rate of evolutionary change in a population is proportional to the amount of available (additive) genetic diversity within it.
The level of heterozygosity within a population is (sometimes) related to fitness. Heterozygosity = the mean proportion of loci heterozygous in a population. Loss of genetic diversity, as indicated by heterozygosity, may thus have both long and short-term effects. In the long term lower genetic diversity retards evolutionary adaptation. Much of the genetic variation in a species or among populations has accumulated over long evolutionary time. Not only potential, but the actual adaptive traits may be lost.
In the short term loss of genetic diversity leads to increased homozygosity, i.e. a greater probability of identical alleles across loci. Loss of genetic diversity also elevates the risk of inbreeding, i.e. matings in which parents are related due to common descent. The consequence is Inbreeding Depression: reduced fitness through lower survival and reproduction. Both short-term & long-term effects will increase extinction probability.
Some genetic measures and statistics you need to know: An Individual’s Inbreeding coefficient (F) is the probability that alleles at a locus are identical by descent. F ranges from 0, i.e parents unrelated, to 1 when inbreeding is complete In a 2 allele system: brother-sister matings have F = 0.25 With Self fertilization F = 0.5
Effective population size Ne: The effective population size is the population contributing to heritable genetic variation. Usually heritable variation is contributed effectively by few individuals. Thus an actual count or Nc may be a poor indicator of population endangerment. Ne is important because it determines the rate of loss of H(eterozygosity)per generation. Ne/Nc ratios average 1/10.
Why should Ne < N ? Age structure: mature vs immature Sex ratio: often uneven. Examples? Unequal family size Non-random mating Let’s go through how each of these potential reasons affects effective population size:
The effect of sex ratio on Ne An example: Assume a population has 500 mature adults. Within it the sex ratio is 50:50, there is random mating, and there is equal reproductive success. Then: Ne = (4*250*250)/(250+250) = 500 However, this is unrealistic. Typically there is dominance, social structure, and sex-related mortality.
Now consider a population of essentially similar size – an elephant seal population where there are 5 breeding males and 500 breeding females. Each male mates with a harem of 100 females. Ne = (4*500*5)/(505) = 19.80 Any deviation from 1:1 sex ratio decreases ratio of Ne:N
The effect of variation in family size on Ne If we know all family sizes, we can use the variance in family size in a simple formula: or Where s2 = variance in family size, k = mean number of progeny
An example: Assume a stable population with a mean family size = 2 and an average of 1 Male & 1 Female to replace each parent. Assume s2 = 2: some Females have 0 offspring; some 4. If Nc = 10, Ne = (4*10)/(2+2) = 10 (using the simple formula), or = 2(20 – 1)/[2 + 2(2-1)] = 9.5 This is again unrealistic.
The effect of variation in population size on Ne Variation in the environment. can cause major fluctuations in population size over time - e.g. predator-prey cycles: In the lynx/ snowshoe hare predator-prey cycle the population size of the hare has shown an 80 fold change in abundance in the cycle.
In small populations drift has a large influence on genetic loss. Greater genetic diversity is lost through drift after population crashes. Even if numbers recover rapidly, effects of low population size inbreeding may still be apparent. Ne is estimated using the harmonic mean and time over which fluctuation occurs: t = no. generations Ni = population size at each time or generation
An example: Northern Elephant seals were hunted to near extinction. Assume that at the low the population had decreased to 20-30 individuals, but now has recovered to 100,000. For the sample calculation assume an initial population of 100,000, then a crash to 20 then back to 100,000. What is the effect of this crash and recovery on Ne?
If decline and recovery each took 1 generation – 1/Ne = 1/3[1/100000 + 1/20 + 1/100000] Ne = 59.98 If decline and recovery occurred over 6 generations in total, and growth was essentially linear over those generations – 1/Ne = 1/6[1/100000 + 1/20 + 1/100 + 1/1000 + 1/10000 + 1/100000] Ne = 98.17
When Ne is low genetic diversity loss exacerbated by: drift low gene flow non-random mating uneven sex ratio The influence of Ne on the level of diversity remaining in the next generation is estimated as:
If Ne is large, terms subtracted from 1 will be low. Most of the genetic variation will remain in next generation. Here’s a plot of genetic variation remaining as a function of Ne and generations:
Note from the figure that the level of diversity remaining is also affected by the number of generations Ne remains at a low level. The formula for the remaining diversity after t generations is: Again by example, assume the Ne = 10 and loss occurs over 10 generations: Remaining fraction of diversity = (1-[1/(2*10)])10 = 0.9510 = 0.6
Effect of drift on the loss of rare alleles By definition rare alleles occur at low frequencies since they may not be adaptive. However, those rare alleles could become adaptive if selective pressure changes. Decreasing Ne elevates the rate of loss of rare alleles through drift, and may compromise response to environmental variation.
Now let’s consider the evidence of genetic diversity and the fitness consequences of low genetic diversity…The mean proportion of loci heterozygous averages ~10%, with a range of 0 40%.
There is lots of evidence that genetic diversity is correlated with fitness… # Heterozygote loci vs condition factor in trout vs growth rate in clam vs # assymetric traits in trout vs O2 consumption in Oysters
By definition endangered species have poor survival and reproduction. We would expect to see lower diversity in endangered species. Do we?
Even in species that are not obviously threatened, we would expect to find genetic diversity related to population size… Halocarpus, a New Zealand red-cockaded woodpecker conifer, r = 0.94 r = 0.48
Why is genetic diversity lower in small populations? 1. Genetic drift: random loss of alleles is proportional to population size. The causes: a) Founder effects: young populations are frequently founded by few individuals b) Bottlenecks: populations may be exposed to mass mortality, and decline at least temporarily to small numbers. 2. There is a lower probability of new mutations appearing in small populations.
3. Greater isolation (sometimes): One obvious reason for small population size is isolation due to some form of habitat fragmentation. There is less gene flow among such populations, and as a result genetic homogenisation within fragments. Small population size, low gene flow, and isolation all point to islands as a good place to explore genetic diversity, fitness, and extinction.
Genetic factors associated with elevated extinction risk in Island populations • Endemic island species have shown high risk of extinction. 75% of extinctions since 1600 and 90% of bird extinctions have occurred in island endemics. Why? The main reasons: • Introduced species • Habitat destruction • Exploitation • Is inbreeding a major factor?
Frankham (1998): reported high levels of inbreeding in island populations, but found that endemic island populations were more inbred than non-endemic island populations. A survey of deliberately inbred lab and domestic populations found a negative correlation between survival and inbreeding: The point at which domestic populations suffered elevated extinction was within the range of F ( inbreeding coefficients) in island populations.
There is also clear evidence that inbreeding compromises fitness in captive animals from juvenile mortality in inbred vs. outbred captive mammal populations:
Let’s finish with an example of a species of conservation interest and prority, the flightless Galapagos Island Cormorant:
Whole pop. = 1000 • Long lifespan, stable #s, sex ratio, age structure. • Distributed in 10 sub-populations with considerable gene flow among them. • However reproductive success is low & variable. • Estimates of overall Ne = 648. This is < Nc • Low Ne & Nc suggest high risk of inbreeding depression
With estimates of Ne and the amount of genetic diversity lost per generation we can predict levels of inbreeding. • Loss per generation: • 1/(2*648) = 0.0008 (0.08%) lost per generation • Valle (1995) estimated that a level of homozygosity of 0.997 would be achieved in 189,000 years, but that 95% of expected heterozygosity would be lost in only ~54,000 years. • Why so high? • No regional populations • Small Ne, thus a low rate of new mutations • Lack of future evolutionary potential = high extinction probability
How can we rescue wild species in which low Ne and high inbreeding predict extinction? Appropriate Management: 1. Providing benign environments: managed reserves low predator prevalence minimize disease limit disturbance reduce habitat loss 2. Supplement genetic diversity through reintroductions