Understanding Conservation and Population Genetics: Allele Frequencies, Heterozygosity, and Migration
140 likes | 269 Vues
This document explores key concepts in conservation and population genetics, focusing on allele frequencies, heterozygosity, and genetic diversity within populations. It discusses factors influencing genetic diversity, such as mutation rates, demographic history, genetic drift, and migration. Additionally, it introduces the concept of population differentiation through fixation indices (FST) and their applications in assessing gene flow and detecting natural selection, with examples from elk subspecies in California. Understanding these principles is crucial for effective wildlife management and conservation strategies.

Understanding Conservation and Population Genetics: Allele Frequencies, Heterozygosity, and Migration
E N D
Presentation Transcript
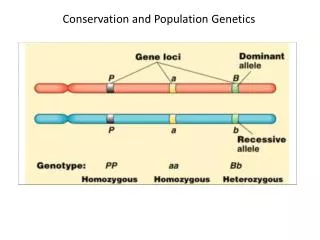
Allele Frequencies The total number of copies of an allele divided by (for mammals) 2N. Aa AA aa Aa AA aa Aa Aa Aa Aa AA aa AA p = 14/26 = 0.53; q = 12/26 = 0.47
Heterozygosity Aa AA aa Aa AA aa Aa Aa Aa Aa AA aa AA Population Individual Aa BB cc Dd HP – The average heterozygosity in a population. HI – The percentage of loci at which an individual is heterozygous HP = 0.461 HI = 0.5
Several Factors Influence Genetic Diversity • Mutation Rate – this is the rate that new variants are generated and • usually is fairly constant. 2) Demographic History – Populations that have recently either expanded or contracted tend to have low diversity; stable populations tend to have relatively higher diversity. 3) Genetic Drift – The random sampling of parental alleles can lead to decreased diversity. This is especially a factor for small populations, so small populations tend to drift to low diversity. 4) Migration – Populations that receive a lot of immigrants tend to have high diversity.
Population Differentiation How strongly differentiated are two (or more) populations? FST – Fixation index – First developed by Wright decades ago. The correlation of randomly chosen alleles within the same population relative to the entire set of populations. 2) The proportion of genetic diversity in a sample that’s attributable to allele frequency differences among or between populations. The fixation indices (FST and its analogues: RST, GST, fST) are really flexible, in that they allow us to evaluate several processes relevant to molecular ecology. An excellent recent overview is provided by Holsinger & Weir (2009). http://digitalcommons.uconn.edu/eeb_articles/22/
Population Differentiation Example: Elk (Cervuselephas) subspecies in California Meredith et al. (2007. J. Mammal. 88:801) estimated genetic differentiation among these using microsatellite data. Rocky Mountain elk (C. e. nelsoni) FST(nelsoni – nannodes) = 0.28 FST(roosevelti– nannodes) = 0.30 FST(nelsoni – roosevelti) = 0.14 Tule elk (C. e. nannodes) Roosevelt elk (C. e. roosevelti)
Applications of Fixation Indices Migration / Gene Flow One of the classic equations in population genetics relates gene flow (migration) to FST. FST 1/(4Nem +1) Ne is the effective population size & m is the fraction of each population that are migrants. ~ ~ Assumptions: Infinite number of populations. Same Ne in each population. Island model of migration. Fantasy Island Model
Applications of Fixation Indices Migration/Gene Flow & Landscape Genetics What landscape features influence gene flow? Cervuselephasin Scotland Most of the variation in FST is explained by distance between populations: Isolation-by-Distance. Some population pairs that don’t fit I-b-D predictions. These are separated by lakes, not roads, as might be predicted. Perez-Espona et al., 2008. Mol. Ecol., 17:981
Applications of Fixation Indices Detecting selection FST can be calculated for each locus, just like HP. We can then look for outlier loci, that show unusual level of differentiation.
Applications of Fixation Indices Detecting selection Storz, J. 2005. Mol. Ecol. 14:671 Peromyscusmaniculatus The albumin gene is subject of selection in high elevation populations.
Identification of management units and tests of taxonomy. Preble’s meadow jumping mouse – Zapushudsoniuspreblei. Listed under the ESA. Z. h. preblei Z. h. campestris Z. h. pallidus Z. h. luteus Ramey et al. (2005) recommended delisting. Figure from Ramey et al. (2005).
Identification of management units and tests of taxonomy. Data from King et al. (2006)
Identification of Mating Systems Two loci with multiple alleles • Exclusion Analysis Microsats are often variable enough for use in paternity analysis. Locus A 100 102 104 106 108 Locus B 230 232 234 236 238 Locus A Locus B Pup: 100 – 106 232 - 234 Male 1: 100 – 108 230 - 236 Male 2: 104 – 106 234 - 236 Male 3: 102 – 108 232 - 234 Male 4: 108 – 108 230 - 234 Male 5: 104 – 108 230 - 238
Identification of Mating Systems Antilocapraamericana Monestrous: estrus occurs one night per year. Females wander through several males' territories and engage in courtship chases. Based on observations of behavior, it was thought that females mated only once. Females produce twins, so it’s easy enough to see if the twins have the same fathers. It turns our that 11 of 25 sets of twins have different fathers.