Download
1 / 108
1.64k likes | 4.56k Vues
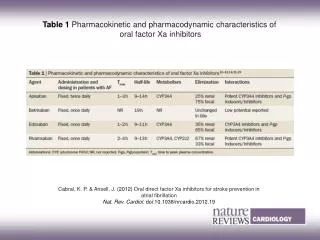
Allometric scaling to predict pharmacokinetic and pharmacodynamic parameters in man. ECOLE NATIONALE VETERINAIRE T O U L O U S E. PL Toutain UMR 181 Physiopathologie et Toxicologie Expérimentales INRA, ENVT. Introduction to allometry.

E N D
Allometric scaling to predict pharmacokinetic and pharmacodynamic parameters in man ECOLE NATIONALE VETERINAIRE T O U L O U S E PL Toutain UMR 181 Physiopathologie et Toxicologie Expérimentales INRA, ENVT
Introduction to allometry Allometry (a term coined by Huxley & Tessier 1936) is the study of size and its consequences
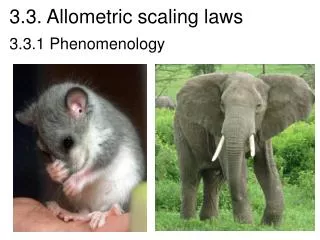
Range of body size in mammals Blue whale: >108 g Shrew 2 g Allometry is the study of size and its consequences • Interspecies allometric scaling is based on the assumption that there are anatomical, physiological and biochemical similarities among animals which can be described by simple mathematical models
Range of body size in mammals:extrapolation within species Young to adult Adult to adult
Many allometric relationships have been established between body size and organ weight as well as body size and physiological process
Simple allometry Y=aBWb
The power function Y =aBWb Where Y is the parameter of interest, BW is the body weight, a & b are the coefficient and exponent of the allometric equation respectively The log transformation of this equation is represented as : log Y = log a + b x logBW Linear plot: slope=b and intercept=log A the slope of the line (b) indicates the type of scaling relationship
Simple allometry: the log-log transformation logY=log a +b log BW b=slope Y=aBWb log a is the Y-intercept
The scaling exponent (b) i.e. the slope defines the type of scaling relationship b=1.25 Y increase faster than BW Positive allometry b=1.0 Y increase proportionally with BW (isometry) b=0.75 Y increase slower than BW Negative allometry
The assumption behind the log-log transformation • It is assumed that there is a constant %CV about the value of PK parameter associated with BW being considered
The log-log transformation log-log transformation of the data will visually minimize the deviations from a regression line A high R2 (e.g. 0.95) do not guarantee that all the data point will be close to the regression line The extrapolation of this regression line to obtain a predicted human value may have a great uncertainty The regression process does not treat the weight of each animal species comparably Direct fitting of power function with incorporation of a weighting strategy has been shown not to improve the prediction performance
The log-log transformation • When there is a limited number of species associated with the regression analysis, each data point has the greatest impact on the prediction of Y for animals whose value of BW are closer to the deviant observation
How does a the distribution of body weight used in the regression analysis influence the prediction of Y • For any species included in the regression analysis, how does its location on the X-axis (i.e; its value of BW relative to other observed data points) influence prediction of Y • Can we anticipate the impact on prediction error by the goodness of fit (R2) of the regression line
Number of species and the regression line • When there is a limited number of species associated with the regression analysis, each data point has the greatest impact on the prediction of Y for animals whose value of BW are closest to the deviant observation • When a midpoint species (dog in vet medecine) is the source of the error, the change is primarily in the intercept rather the slope; consequently the resulting magnitude of prediction error is comparable throughout the range of BW values examined
Influence on the predicted value in man of a 30% decrease of the clearance value for a given species
ACCURACY OF ALLOMETRICALLY PREDICTED PHARMACOKINETIC PARAMETERS IN HUMANS: ROLE OF SPECIES SELECTIONHuadong Tang and Michael Mayersohn Drug Metabolism Disposition, 2005, 33 (9) 1288-1293
ACCURACY OF ALLOMETRICALLY PREDICTED PHARMACOKINETIC PARAMETERS IN HUMANS: ROLE OF SPECIES SELECTIONHuadong Tang and Michael Mayersohn Drug Metabolism Disposition, 2005, 33 (9) 1288-1293 As demonstrated by both theoretical and literature experimentation, rats had no significance in predicting human PK parameters as long as the body weight of the rat is not the smallest in the species used in the allometric relationship.
Historical developments:the direct extrapolation of doses from animals to man
The Use of Body Surface Area as a Criterion of Drug Dosage in Cancer Chemotherapy Donald Pinkel (Department of Pediatrics, Ronwell Park Memorial Institute and University of Buffalo School of Medicine, Buffalo, N.Y.) Cancer Res 1958 28 853-856
The use of body surface area as a criterion of dosage regimen in cancer chemotherapy (From D Pinkel :Cancer Res 1958 28 853-856) Mouse=0.018 Body weight in Kg Infant=8 Child=20 Rat=0.25 Adult=70
Body surface area in man • The DuBois and DuBois formula • BSA (m²) = 0.20247 x Height(m)0.725 x Weight(kg)0.425 • The Haycock formula • BSA (m²) = 0.024265 x Height(cm)0.3964 x Weight(kg)0.5378 • The Gehan and George formula • BSA (m²) = 0.0235 x Height(cm)0.42246 x Weight(kg)0.51456 • The Boyd formula • BSA (m2) = 0.0003207 x Height(cm)0.3 x Weight(grams)(0.7285 - ( 0.0188 x LOG(grams) )
Comparison of toxicity data acquired during clinical studies of 18 anticancer agents with those obtained in mice, rats, dogs, and rhesus monkeys uncovered close interspecies correlations when doses were related to body surface, much closer than when doses were related to mass. This finding has guided numerous trials of anticancer and other agents.
Comparison of toxicity data on anticancer agents for the Swiss mouse and man (on a mg per m2 basis) From Freireich et al 1966 1000 100 Antimetabolites Alkylating agents Others 10 Maximum tolerated dose (mg per m2) 1.0 0.1 10 1000 Mouse LD10 mg per m2
Observed and predicted dosage (mg per m2) in man using animal system (Freireich & al 1966)
Interspecies scaling of maximum tolerated dose of anticancer drugs • In general, small animal require larger dose than human to reach the MTD. • Wanatabe et al used the LD10 mice data from 25 anticancer drugs and concluded that the MTD in human can be predicted from mice LD1 using a scaling power of 0.75 • Actually the use of a fixed exponent cannot be justified
Slope actually from 0.60 to 0.84 Data from Freireich & al 1966
Body weight or body surface area? • BSA is not directly measured but estimated with allometric equations • For a given species, it may exist several equations predicting BSA • There is no advantage using BSA over BW
PD PK The determination of an ED50 or any ED% ED50 = ED50 - is a hybrid parameter (PK and PD) - is not a genuine PD drug parameter Clearancextarget EC50 Bioavailability
Cardiac output in mammals In mL per minute Body Weight in kg
Interpretation of body clearance • Interpretation of body clearance consists of calculating an extraction ratio Body clearance (blood) Cardiac output Ebody =
What is a dose? Cardiac output (L per day) µg/L µg per day
Dose (IV) for an hepatic cleared drug with a low or a high hepatic extraction ratio (ER) Low ER The plasma protein binding and metabolism activity are the major determinants for the elimination of low hepatic clearance drugs; therefore it is not expected to have a good allometric relationship with BW across species for this kind of drug High ER Because hepatic blood flow is shown to have an allometric relationship with BW, it is expected that the elimination of high hepatic clearance drug can show an allometric relationship with BW
PD Clearancextarget EC50 Bioavailability Interspecies scaling of pharmacodynamic parameters ED50 =
Interspecies scaling of pharmacodynamic parameters • Very little information is available for the prediction of pharmacodynamic (PD) parameters from animal to man • It is conceptually difficult to accept that the efficacy and potency of a drug will relate with body weight of the species
Allometry of pharmacokinetics and pharmacodynamics of the muscle relaxant metocurine in mammals
Interspecies scaling of pharmacodynamic parameters:The case of Ketoprofen (sKTP) • Cat, goat, sheep, calf, horse • Endpoints: inhibition of the synthesis of thromboxan (TXB2) and prostaglandinE2 (PGE2) • No relationship between IC50 (or other PD parameters) with BW
Modeling and allometric scaling of s(+)-ketoprofen pharmacokinetics and pharmacodynamics: a retrospective analysis E.-I. LEPIST & W.J. JUSKO, J. Vet. Pharmacol. Therap. 27, 211-218, 2004 ANTIINFLAMMATORY DRUG
Interspecies scaling of pharmacodynamic parameters:the case of anaesthetic potency minimum alveolar concentration (MAC) • Poor correlation between BW and MAC for several inhalation anesthetics • Travis & Bowers 1991in: Toxicol Ind Health 1991 7 249-260
In vitro data: Drug affinity & drug potency Drug potency from in vitro: MIC for antibiotics Benzodiazepine dose and benzodiazepine affinity
Interspecies scaling of pharmacokinetic parameters ED50 = Clearancextarget EC50 Bioavailability
Absorption Volume of distribution Clearance bioavailability Half-life Systemic exposure Dosage regimen How much Dosing regimen How often?
Acute toxicity of anticancer drugshuman versus mouse AUC Ratio Internal dose Dose Ratio External dose Frequency
Scaling of antipyrine intrinsic clearance in 15 mammalian species Boxenbaum & Fertig Europ J Drug Metab Pharmacokinet 1984 9 177-183
The concept of neoteny • Retention of juvenile characteristics in the adults of species • The modern man retained its juvenile characteristics of its ancestors (apes) through the retardation of somatic development for selected organs