Point Biserial Correlation Example
Point Biserial Correlation Example. A researcher wishes to determine if a significant relationship exists between the gender of the worker and if they experience pain while performing an electronics assembly task.

Point Biserial Correlation Example
E N D
Presentation Transcript
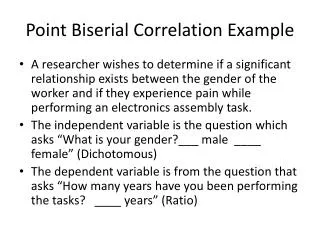
PointBiserialCorrelation Example • A researcher wishes to determine if a significant relationship exists between the gender of the worker and if they experience pain while performing an electronics assembly task. • The independent variable is the question which asks “What is your gender?___ male ____ female” (Dichotomous) • The dependent variable is from the question that asks “How many years have you been performing the tasks? ____ years” (Ratio)
Step 1: Data Setup • The independent variable is the “x” variable and the dependent is the “y”.
HypothesisSetup • Ho: There is no relationship between the number of years performing the tasks and the workers’ gender. • H1: There is a significant relationship between the number of years performing the tasks and the workers’ gender. • Use an Alpha Level=.05
Point Biserial Correlation Formula The correlation coefficient of .87 is a strong correlation. We must use a T-test to determine if it is significant.
Is the Correlation Significant? • Now we need to determine if the correlation coefficient of .87 is significant. • This is done by performing a t-test.
T-test for Correlations To interpret the .87, compare the 5.11 to the critical score. If the obtained score is greater than the critical score, reject the Null and accept the alternative. The critical score from the t-table at .05 and DF = 8 is 2.31. (NOTE: On a T-table, use the .025 column since .025 at one end and .025 at the other end gives you .05).
T-Table The critical score from the t-table at .05 and DF = 8 is 2.31. (NOTE: On a T-table, use the .025 column since .025 at one end and .025 at the other end gives you .05).
Conclusions • Since 5.11 is greater than 2.31, Reject the Null Hypothesis and conclude there is a significant relationship between gender and the number of years working at the task. • There is a significant relationship between the genders of the workers the number of years performing the task. Males have been performing the task significantly longer than females.